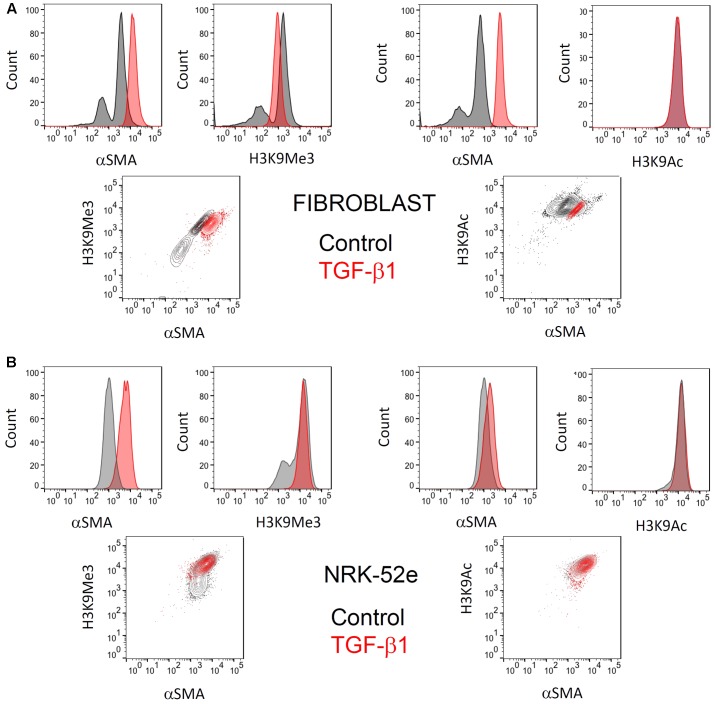
FIGURE 6.
Representative flow cytometric analysis comparing the effect of TGF-β1 stimulation on H3K9 marks and αSMA expression in (myo)fibroblasts and NRK-52e. Flow cytometric analysis of H3K9Ac and H3k9Me3 modifications, and their relationship with (A) myofibroblast differentiation after 48hrs of treatment with 1 ng/ml TGF-β1 and (B) αSMA expression in NRK52e after 48 h of stimulation with 10 ng/ml TGF-β1. Normalized frequency histograms with the control cell group shown in gray and TGF-β1 stimulated cells plotted in red. Contour plots depict changes in double-staining.

