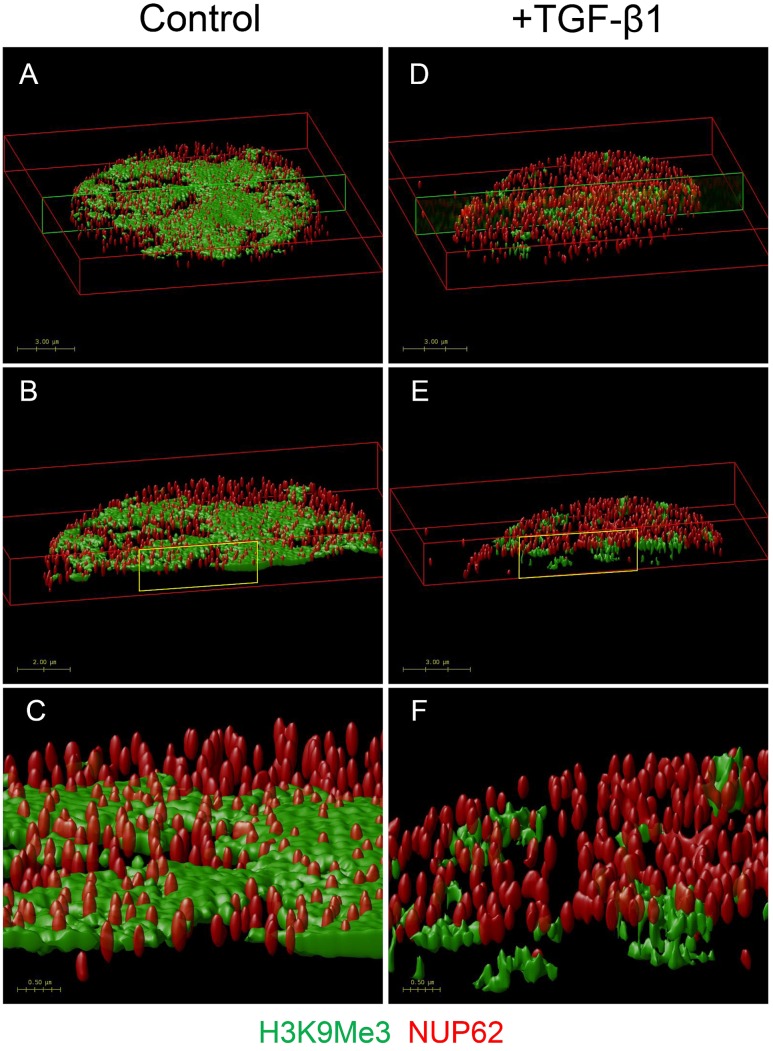
FIGURE 8.
OMX super-resolution microscopy demonstrating the effect of TGF-β1 on the nuclear distribution of H3K9Me3 marks. Volume rendered images showing effect of TGF-β1 on distribution of H3K9Me3, and its relationship with the nuclear envelope. H3K9Me3 marks are shown in green with individual nuclear pores seen with red NUP62 staining. Refer to Supplementary Figure S3 for representative optical cross sections of immunofluorescent staining before image stacking and volume rendering. Figure shows the top 2 μm of nuclei from cells grown in (A) control media and (D) media supplemented with 1 ng/ml TGF-β1. A transverse cross section of each is indicated by the green box, and illustrated in (B,E). A higher magnification of the areas marked in yellow (C,F) clearly shows the relative position of NUP62 and H3K9Me3 with and without TGF-β1 stimulation.

