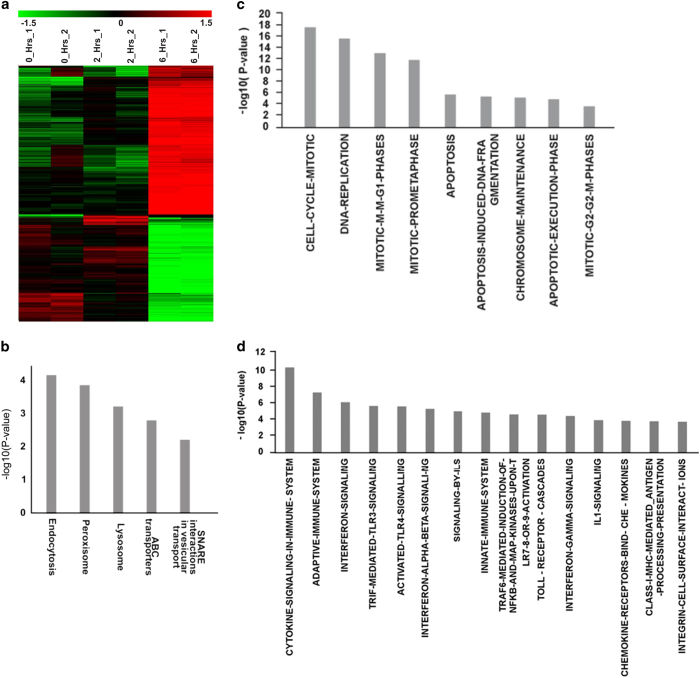
Figure 5.
Microarray and pathway analysis of NIH3T3 cells treated with dead Jurkat cells. (a) Heat map of significantly differentially expressed genes in NIH3T3 cells treated with dead Jurkat cells at 0, 2 and 6 h in duplicates. Time points are shown in columns and differentially expressed genes in rows. They were grouped together based on the hierarchical clustering method. Red signifies upregulation status, whereas green signifies downregulation. Black color depicts no change in expression. Scale of heat map shown on the top of the figure. (b–d) Pathway analysis at 6 h showing upregulation of pathways associated with phagocytosis; cell cycle/DNA damage and inflammation, respectively.

