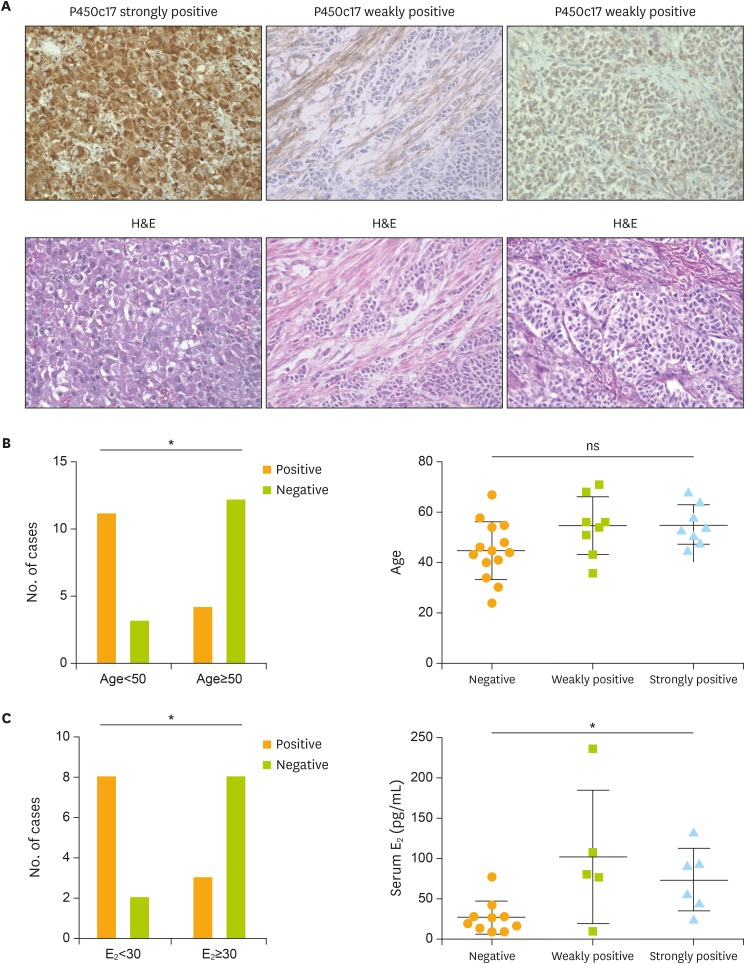
Fig. 3.
Relationships between P450c17 expression and patient age and serum E2 levels. (A) Representative images of P450c17 expression. Samples are strongly positive (score 2) for P450c17 in luteinized cells (left upper), and weakly positive (score 1) for P450c17 in theca- or fibroblast-like cells (middle upper) and tumor cells (upper right), as determined by immunohistochemistry (original magnification: ×40). (B) Number of cases positive (score 1 or 2) or negative (score 0) for P450c17 among patients under and over 50 years of age (n=14 and 16, respectively). (C) Number of cases positive or negative for P450c17 among patients with serum E2 below or above 30 pg/mL (n=10 and 11, respectively).
E2, 17β-estradiol; H&E, hematoxylin and eosin staining; ns, not significant; P450c17, P450 17α-hydroxylase.
*p<0.05 (B, C: Fisher's exact test).

