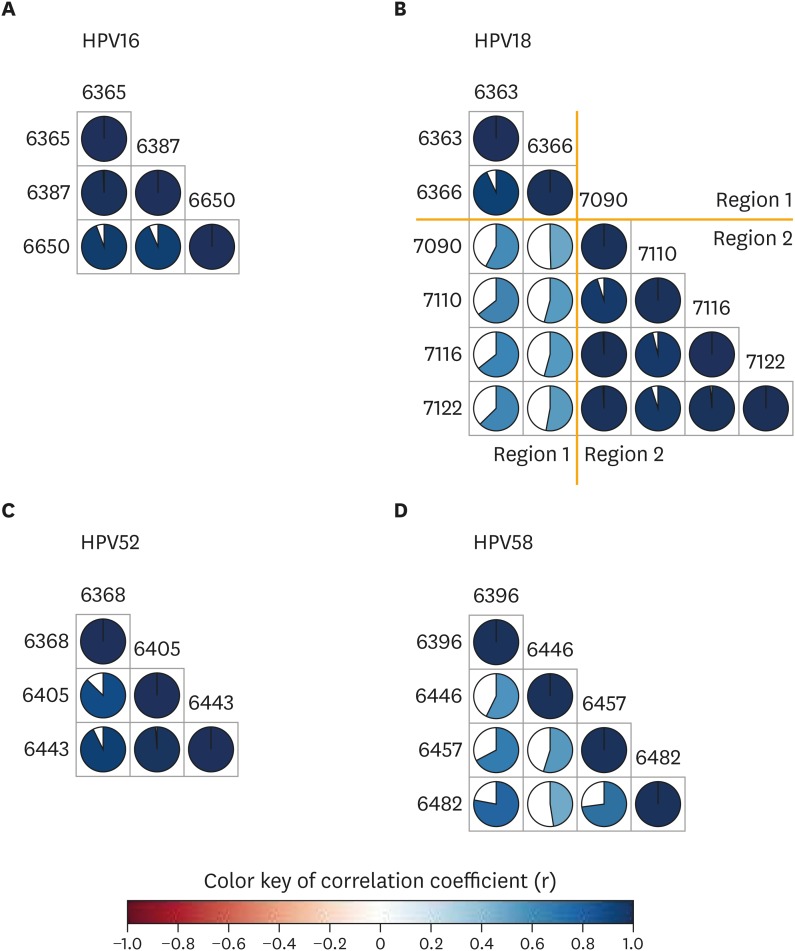
Fig. 2.
The correlation between any 2 CpG methylation on HPV L1 region. Each circle indicates the correlation coefficient of methylation between any 2 CpG sites. (A) HPV16. (B) HPV18. (C) HPV52. (D) HPV58. Blue indicates a positive correlation and red indicates a negative correlation.
CpG, C-phosphate-G; HPV, human papillomavirus; L1, late gene 1.

