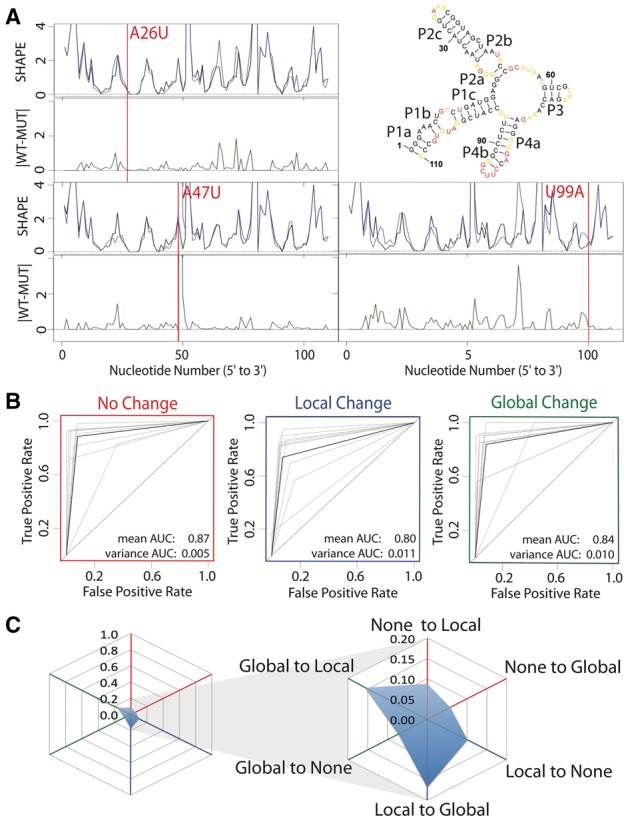
Fig. 2.

Expert evaluation of RNA structure change in SHAPE data. (A) Accepted WT structure for the 16S four-way junction domain from the E.coli ribosome in agreement with the crystal structure and multiple structure probing experiments (Cordero and Das, 2015; Tian et al., 2014; Zhang et al., 2009). Red nucleotides indicate high SHAPE reactivity, yellow indicates mid-range reactivity, and black indicates low reactivity. For each mutant, the WT trace (black) is overlaid with the mutant SHAPE trace (dark blue). The absolute difference between the WT and mutant traces is depicted below (dark green). 100% of experts that evaluated the A26U WT mutant pair agree that there is no difference or a small difference. 88% of experts agree that the A47U mutation creates a local difference. Experts are split on the U99A mutation. 37.5% of experts indicated that the mutation creates no difference or a small difference, 37.5% of experts indicated that the mutation creates a local difference and 25% of experts indicated the mutation creates a global or distant mutation. (B) ROC curve analysis was used to compare expert classification to the majority vote consensus. The gray curves represent individual expert performances, while the black curves show the average performance among experts. The ROC curves are depicted for performance in identifying non-changers (red), local changers (blue) and global changers (green). (C) Cobweb plots show the percentage of mutants mislabeled by the expert majority vote with non-changers on the red axes, local changers on the blue axes, and global changers on the green axes. Expert classification is least consistent on differences between global and local changers with a higher percentage of global changers mislabeled as local changers, and local changers mislabeled as global changers (Color version of this figure is available at Bioinformatics online.)
