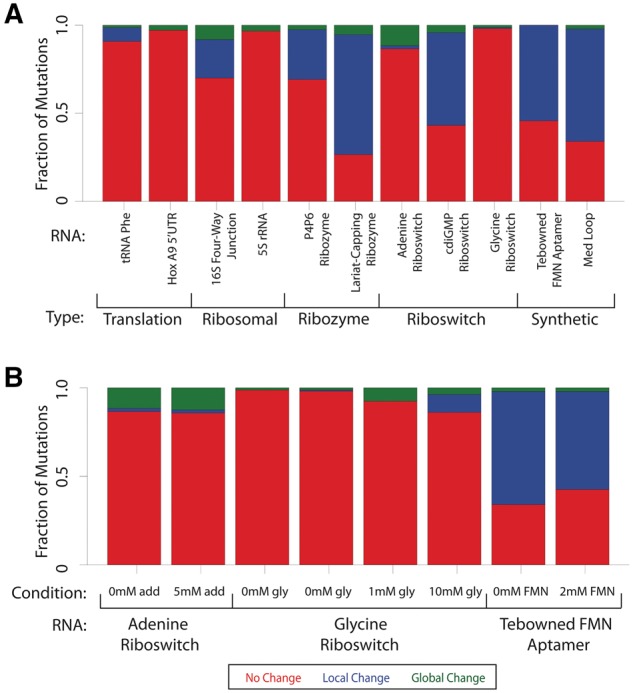
Fig. 4.

Fraction of disruption for individual RNAs. (A) The fraction of mutations that cause no change (red), local change (blue) or global change (green) for each RNA as classified by classSNitch. The RNAs are grouped by biological function: translation, ribosomal, ribozyme, riboswitch or synthetic. The experimental conditions for each of these RNAs are listed in Supplementary Material, Table S1. (B) The fraction of mutations that cause aptamers to change structure in the absence or presence of differing amounts of ligand for the adenine riboswitch, glycine riboswitch and Tebowned FMN aptamer (Color version of this figure is available at Bioinformatics online.)
