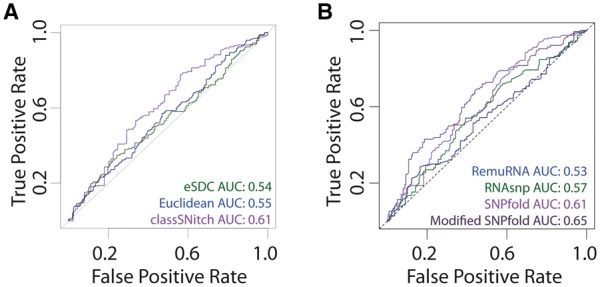
Fig. 5.

Improving the performance of structure change prediction algorithms (Halvorsen et al., 2010; Sabarinathan et al., 2013; Salari et al., 2013). (A) We performed ROC curve analysis for SNPfold, a structure change prediction algorithm, using classSNitch (purple), eSDC (green) and the Euclidean norm (blue) to classify the experimental data using the 10% tails strategy (Corley et al., 2015). (B) We compare the performance of structure change prediction algorithms on the classSNitch classification for SNPfold (purple), RNAsnp (green) and RemuRNA (blue). Each of these algorithms predicts structure change in RNA using only sequence information. SNPfold, remuRNA and RNAsnp all make ab initio predictions on whether a mutation alters the RNA structure; none of the algorithms benchmarked used SHAPE-directed structure prediction since we are using the WT and mutant SHAPE data for experimental validation. We improved the SNPfold prediction (dark purple) using Equation 1. The ROC curves for local and global change predictions are included in Supplementary Materials, Figure S8 (Color version of this figure is available at Bioinformatics online.)
