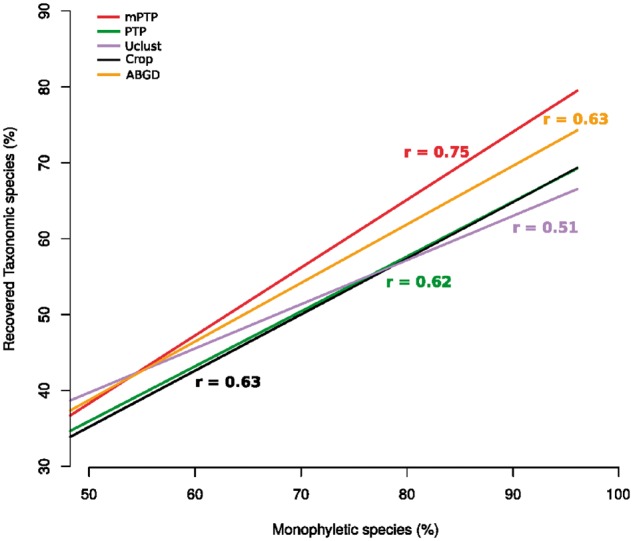
Fig. 3.

For each method, we fit a regression line to the points of correspondence of the percentage of monophyletic species (x-axis) to the percentage of RTS (y-axis). The Pearson coefficient (r) is given for each correlation in the corresponding color
