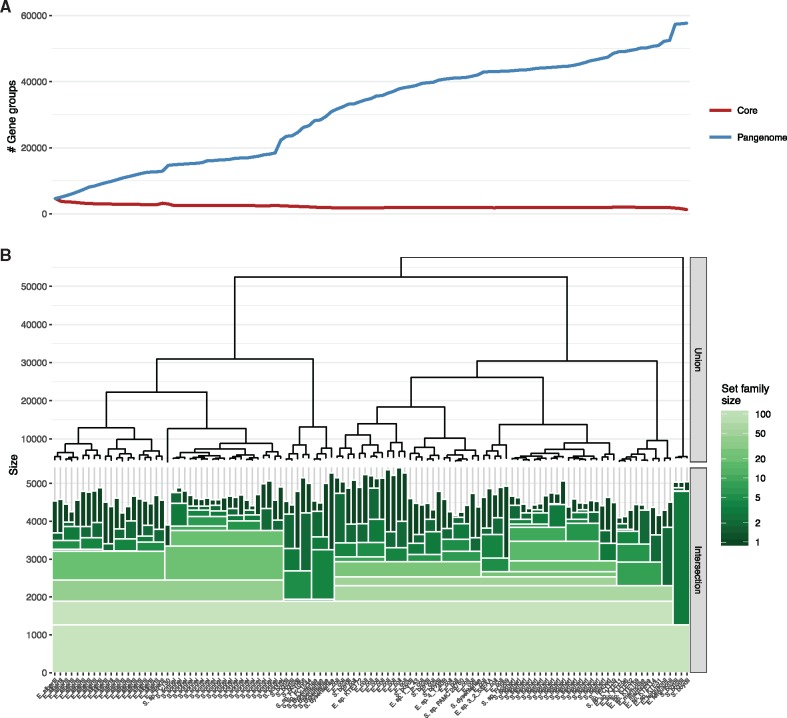
Fig. 3.
(A) A standard pangenome line plot showing the evolution in pangenome and core sizes as genomes are added to the pangenome. A soft core of 95% is used for calculating the core size. The order in which the genomes are added is determined by the ordering from the hierarchical set clustering visualized in B and A and B are thus sharing the x-axis. (B) Intersection and union sizes at the branch points in a hierarchical set clustering with t = 0.95, visualized as an icicle plot for the intersections and a dendrogram for the unions. The intersection size of each set family is encoded to the height of the bar and the size of the set family is encoded to the color of the bar. The area of each rectangle is thus proportional to the number of sets it represents and the increase in intersection size relative to the next branch point

