Fig. 6.

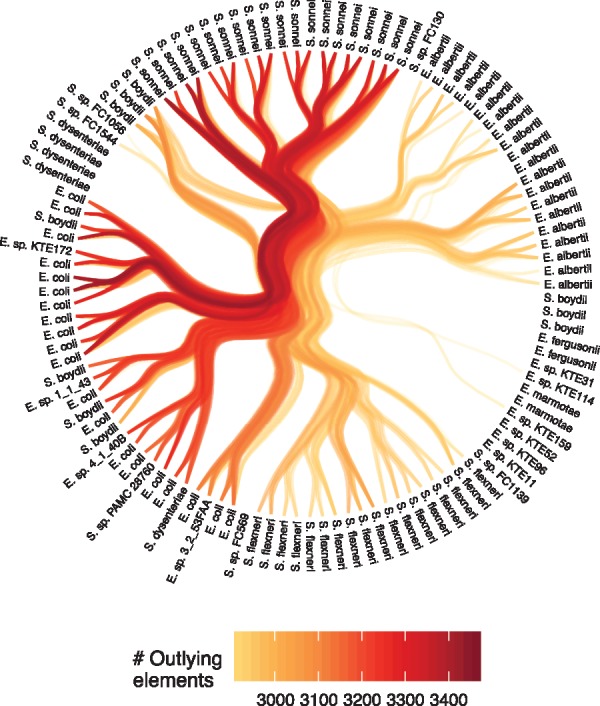
Hierarchical edge bundling showing the 15% strongest deviations from the hierarchy defined by a hierarchical set analysis (measured in number of outlying elements). Color is mapped to number of outlying elements

Hierarchical edge bundling showing the 15% strongest deviations from the hierarchy defined by a hierarchical set analysis (measured in number of outlying elements). Color is mapped to number of outlying elements