
Figure 1.
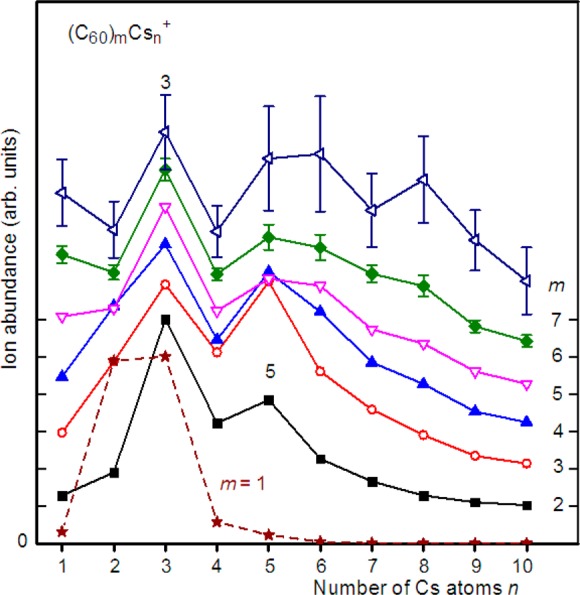
Abundance distributions of (C60)mCsn+, m ≤ 7. The distributions are individually normalized for each value of m and vertically offset (staggered); baselines are indicated on the ordinates. Error bars are not shown when they are smaller than the symbol size. Maxima or abrupt drops occur at n = 3 and 5 for all but the largest m values.