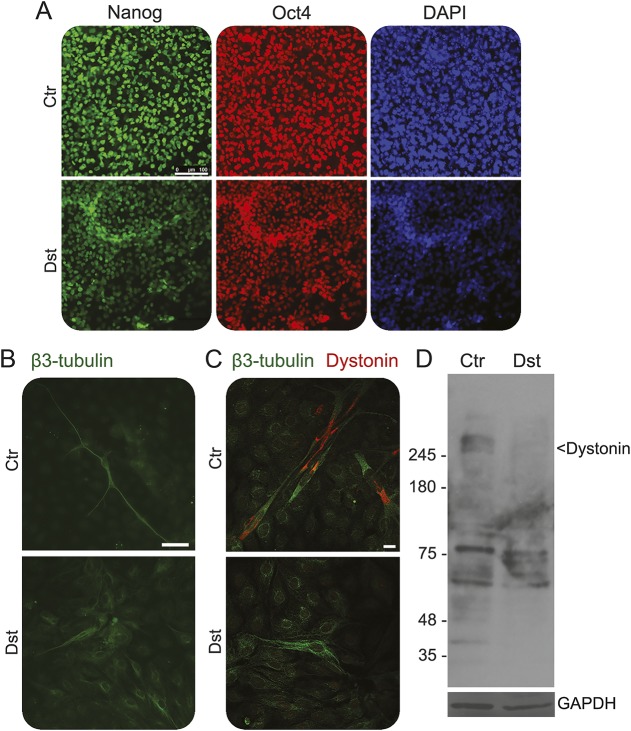
Figure 3. Analysis of dystonin in normal and affected differentiated induced pluripotent stem cells (iPSC).
(A) Normal and affected undifferentiated iPSC were checked for the expression of stemness markers Oct4 and Nanog by immunostaining before differentiation. Scale bar, 100 μm. (B) Normal and affected differentiated iPSC were stained with a specific antibody against β-tubulin revealed by Alexa-488 conjugated secondary antibody. Images were collected by fluorescence microscopy. Scale bar, 50 μm. (C) Confocal images of normal and affected differentiated iPSC stained with β-tubulin (green) and dystonin (red). Scale bar, 10 μm. (D) Western blotting of dystonin in normal and affected differentiated iPSC. GAPDH is used as loading control. Molecular weight markers are indicated.

