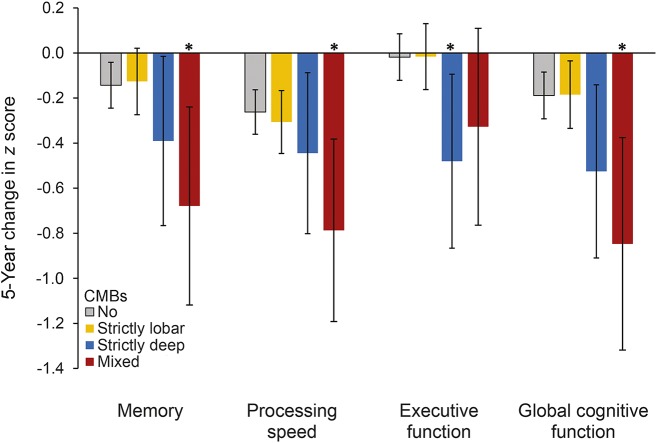
Figure 2. Multivariable-adjusted 5-year change in cognitive domains for CMB locations.
Error bars represent 95% confidence intervals. Adjusted for age, sex, follow-up interval, coil type, primary education, depression at follow-up, hypertension, total cholesterol, use of lipid-lowering medication, presence of brain infarcts, measure of white matter hyperintensity volume expressed as percentage of total intracranial volume, and APOE ε4 carriership. *p < 0.05.

