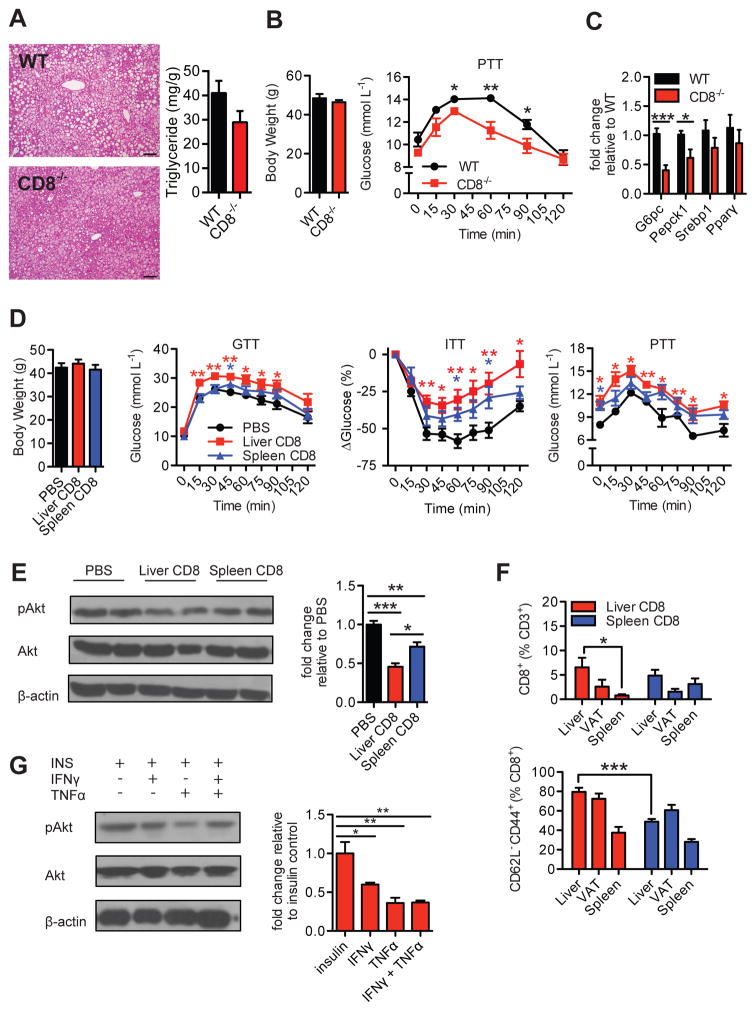
Figure 2. Intrahepatic CD8+ T cells drive hepatic insulin resistance.
16 wk HFD-fed WT and CD8-deficient (CD8−/−) mice (A) representative H&E liver stains (Left, 200X magnification, Scale bar: 100μm; n=3) and liver triglyceride content (Right, n=5), (B) body weights and pyruvate tolerance test (PTT) (n=5), and (C) RT-PCR gene expression analysis of gluconeogenic enzymes (G6pc, Pepck1) and lipogenic factors (Srebp1, Pparγ) (n=6). (D) Body weights, glucose tolerance test (GTT) (n=6, 2 experiments), insulin tolerance test (ITT) (n=6, 2 experiments), and PTT (n=3) of 16 wk HFD-fed CD8−/− mice 1 week after receiving i.v. transfers of 5×10⁶ negatively sorted intrahepatic or splenic CD8+ T cells, or PBS control. Statistical analysis is represented relative to PBS control group. (E) Representative western blot and analysis of liver lysates immunoblotted for phosphorylated and total Akt proteins after acute insulin injection of transfer mice (n=5), and (F) flow cytometry analysis of total CD8+ T cell and CD8+ effector memory T cells in liver, visceral adipose tissue (VAT), and spleens of transfer mice (n=4–6). (G) Representative western blot of pAkt/Akt and analysis of primary hepatocytes treated with 20 ng/ml IFNγ, 20 ng/ml TNFα, or both, or untreated for 24 hrs at 37°C and subsequently treated with 100 nM insulin for 15 min (n=4). Western blot analysis is represented as pAkt/Akt expression relative to control (insulin) group. Statistical significance is denoted by * (p<0.05), ** (p<0.01), and *** (p<0.001).

