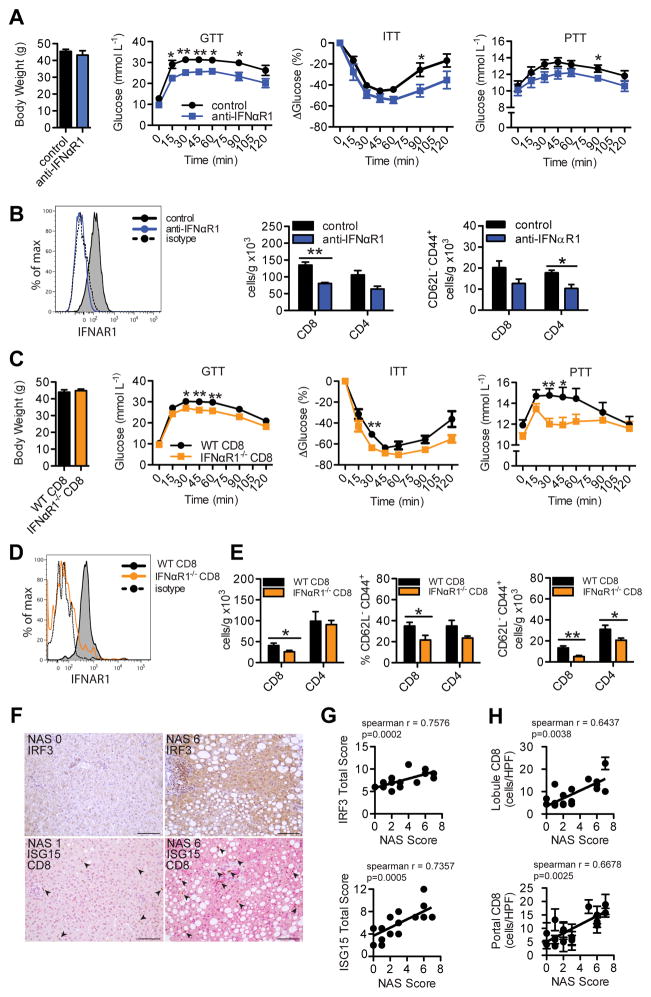
Figure 4. Intrahepatic type I interferon signaling and responsive CD8+ T cells promote metabolic disease in mice and correlate to worsened NAFLD in humans.
(A) Body weights, GTT, ITT and PTT (n=5), and (B) flow cytometry analysis of IFNαR1 expression on CD8+ T cells (representative plot) and hepatic T cell subsets (n=3–4) in WT HFD-fed mice that were treated i.p. with 400 μg/wk of anti-IFNαR1 blocking antibody, or IgG control, for 5 wks beginning at 10 wks of HFD-feeding. (C) Body weight (n=10), GTT (n=10), ITT (n=5), PTT (n=10), (D) flow cytometry analysis of IFNαR1 expression on CD8+ T cells (representative plot) and (E) hepatic T cell subsets in 16 wk HFD-fed BM chimeric mice containing (WT CD8) or lacking (IFNαR1−/− CD8) IFNαR1 expression in CD8+ T cells (n=10). T cells were analyzed using previously stated gating strategies. (F) Representative immunohistochemical staining of human liver biopsies (n=18) given NAS scores and stained single stained for IRF3 (brown), or double stained for ISG15 (pink) and CD8 (brown) (200X magnification, Scale bar: 100μm), and correlative analysis between (G) NAS Score and IRF3 (top, n=19) or ISG15 (bottom, n=18) protein expression, and (H) NAS Score and lobular (top) or portal tract (bottom) CD8+ cells/high power field (HPF = 0.237 mm2) (n=18). Arrows indicate CD8+ cells. Spearman r values and p values denoting statistical significance are indicated in the figure graphs. Statistical significance is denoted by * (p<0.05), and ** (p<0.01).

