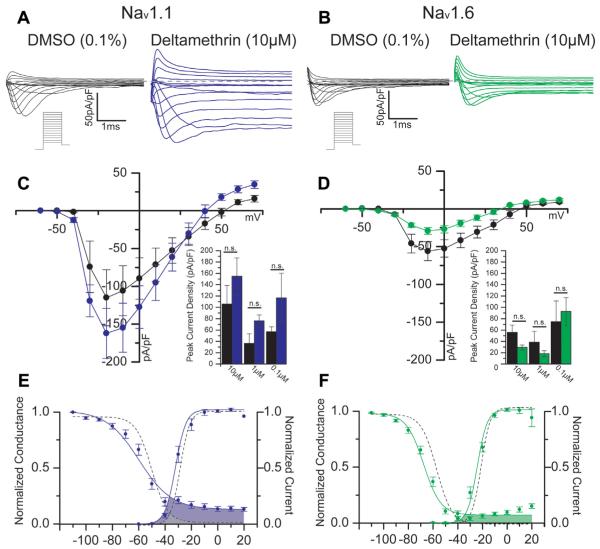
Fig. 1.
Representative traces of HEK-Nav1.1 (A) or HEK-Nav1.6 (B) cells in DMSO or deltamethrin-treated conditions in response to an evoked step-wise protocol (schematic under traces). With DMSO in black, Panels C and D depict a current-voltage relationship for Nav1.1 and Nav1.6, respectively, showing deltamethrin treatment in blue for Nav1.1 and green for Nav1.6. Summary bar graphs comparing peak current densities at −10 mV for all three concentrations are shown below the I–V graphs. Voltage-dependencies of activation and steady-state inactivation are depicted for Nav1.1 (E) and Nav1.6 (F); control curves are represented with dashed lines. Window currents are depicted where activation and steady-state inactivation curves overlap, which is indicated with shaded areas—gray for DMSO and colors for deltamethrin. Error bars indicate SEM. (For interpretation of the references to colour in this figure legend, the reader is referred to the web version of this article.)

