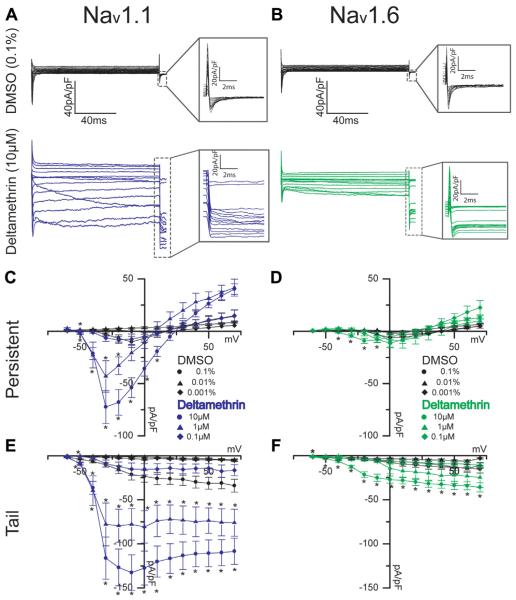
Fig. 2.
Representative traces of persistent currents and tail currents (insets) are shown for HEK-Nav1.1 cells (A) and HEK-Nav1.6 cells (B) with deltamethrin shown in blue and green, respectively. Current-voltage relationships are shown for Nav1.1 and Nav1.6 persistent currents (C, D, respectively) and for Nav1.1 and Nav1.6 tail currents (E, F, respectively). Circles represent 10 μM or 0.1% final DMSO concentration; triangles represent 1 μM or 0.01% final DMSO concentration, and diamonds indicate 0.1 μM or 0.001% final DMSO concentration. Error bars indicate SEM. (For interpretation of the references to colour in this figure legend, the reader is referred to the web version of this article.)

