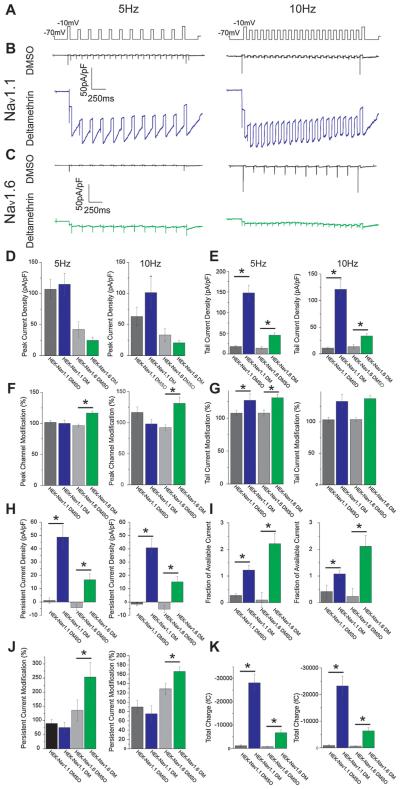
Fig. 4.
Representative traces of: A) Use-dependent stimulation protocols, B) HEK-Nav1.1 cells treated with DMSO (black) or 10 μM deltamethrin (blue), C) HEK-Nav1.6 cells treated with DMSO (black) or 10 μM deltamethrin (green). Below traces are summary bar graphs for both stimulation frequencies representing: D) Peak current density, E) Tail current density, F) Peak current density modification, G) Tail current density modification, H) Persistent current density, I) Fraction of available current, J) Peak current modification, K) Total charge. Error bars indicate SEM. (For interpretation of the references to colour in this figure legend, the reader is referred to the web version of this article.)

