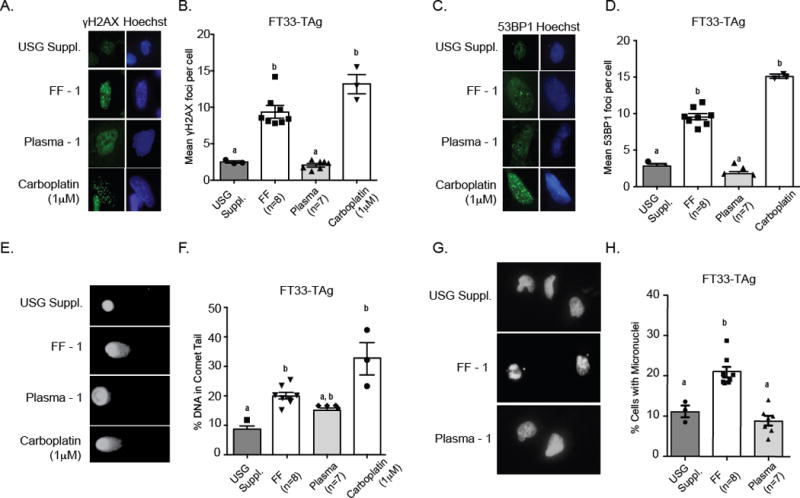
Figure 2. Follicular fluid exposure induces DNA damage accumulation in fallopian epithelial cells.

A) Representative images of FT33-TAg cells grown in USG Suppl., individual patient FF, individual patient plasma, or carboplatin with Hoescht (Blue) staining demarcating the nuclear area, and green staining showing the γH2A.X (A) and 53BP1 foci (C). Quantitative results for γH2A.X (B) and 53BP1 (D) foci in the FT33-TAg cells exposed to treatments. Representative comet assay images of nuclei E) from FT33-TAg cells following staining with SYBR Gold and quantitation of percent DNA F) in comet tail after exposure to individual patient FF, individual patient plasma, or carboplatin. Representative images of micronuclei formation (G) in FT33-TAg cells and quantitation H) of micronuclei formation in FT33-TAg cells after exposure to USG Suppl., individual patient FF and matching individual patient plasma. a,b,cMeans ± SEM within a different superscripts were different (p<0.05).
