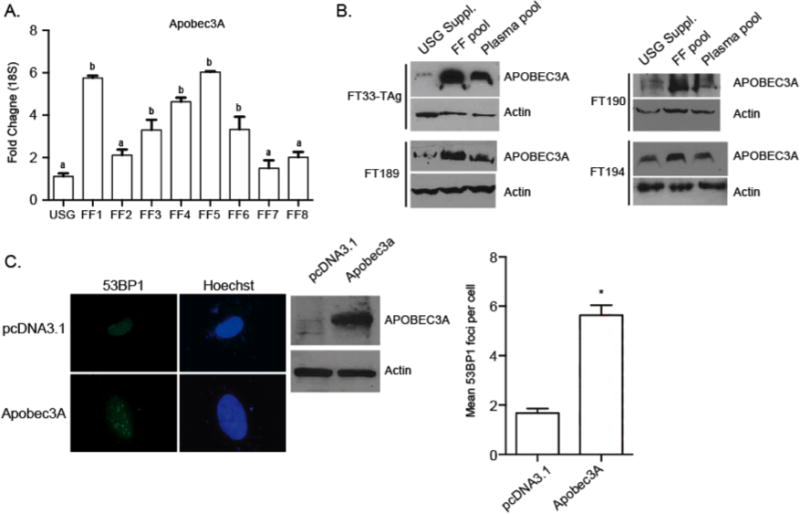
Figure 4. Apobec3A is induced following exposure to human FF.

A) Apobec3A gene expression changes following exposure to individual FF from all 8 patients in FT33-TAg fallopian epithelial cell lines. B) Analysis of the effect of pooled FF and pooled plasma samples on the induction of APOBEC3A protein in all four cell lines. C) Representative image of 53BP1 foci formation in FT194 cells following transient overexpression of Apobec3A or control pCDNA3.1 plasmid DNA. Western blot demonstrating overexpression of APOBEC3A, and quantification of 53BP1 foci. a,b Means ± SEM within panel B were different (p<0.05). Means ± SEM within panels A and C were different (p<0.05) from the USG control or pcDNA3.1 control, respectively.
