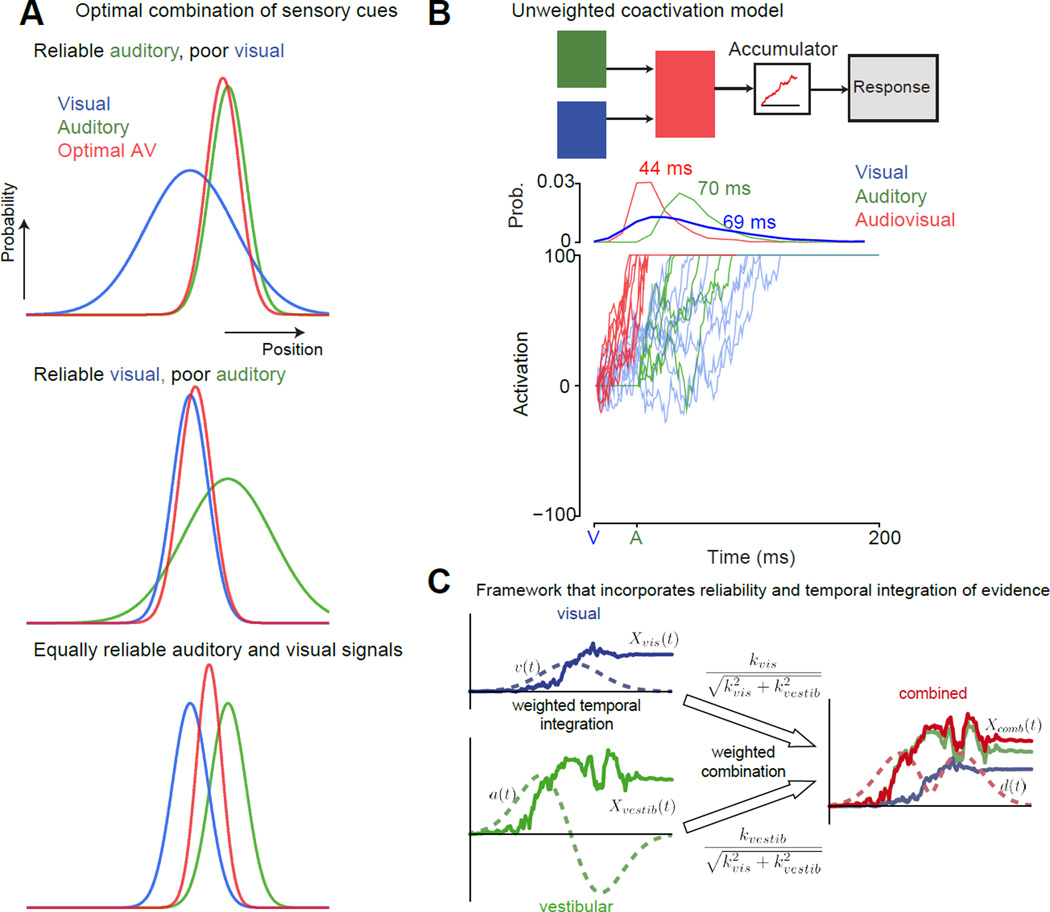
Fig 1. Bayesian frameworks and coactivation models to understand multisensory behavior.
A: Near-optimal cue (or stimulus) combination according to the Bayesian framework to improve discrimination behavior is well understood with an example (adapted from [92]). Consider a cat seeking a mouse with both visual and auditory cues. The curves in the figure show the hypothetical probability distributions of the mouse’s position as estimated by the cat’s brain for the three different modalities (Blue-visual, green-auditory, red-audiovisual). Assume that it is dark, and the mouse is in an environment with many gray rocks roughly the size and shape of a mouse. In this context, the optimal Bayesian cat would use auditory cues to estimate the mouse’s location (top). In contrast, when it is sunny, to optimize its discrimination behavior the cat would largely rely on visual cues to locate the mouse (middle). One can readily imagine many intermediate scenarios where the optimal strategy for the cat is to combine both visual and auditory cues to have the best chance of catching the mouse (bottom). For the case that the cat’s auditory and visually guided estimates of the mouse’s position are Gaussian, independent and unbiased (means: sa, sv and standard deviations σa, σv ), the optimal estimate of the position of the mouse is the weighted average of the auditory and visually guided estimates (Sav = WaSa+WvSv). The weights are the normalized reliability of each cue (). Behavior in multisensory discrimination experiments can be tested to see if they are consistent with this prediction from the optimal framework.
B: An example of a simple coactivation model used to explain detection behavior. Top panel, a cartoon of the linear summation coactivation model typically used to explain multisensory detection behavior [46,47]. Auditory and visual inputs are linearly summed to arrive at a new drift-rate, and this undergoes the drift-diffusion process to the criterion to trigger a response. Bottom panel, simulations from the coactivation model of a few trials of an audiovisual stimulus where a visual cue turns on at t=0 and an auditory cue turns on at t=30 ms. The visual and the auditory stimuli were assumed to be modest in intensity. In this hypothetical integrator, the onset of the visual stimulus before the onset of the auditory stimulus results in an increase in activity. The auditory stimulus can build on this activity, and this results in the criterion being reached faster on average for the audiovisual (44 ms) compared to both auditory (~70 ms RT when measured relative to the visual stimulus onset) and visual-only stimuli (~69 ms). Blue lines denote the visual cue. The green lines denote the auditory cue. Red lines denote the audiovisual cue.
C: A framework that combined the insights from both A and B to develop an optimal coactivation drift-diffusion model to explain multisensory discrimination behavior [48]. This model was developed in the context of a heading discrimination task using both visual and vestibular cues. The key innovation in this model is that it integrates evidence in an optimal manner by factoring in the model both the time course of sensory signals as well as the reliability of the signals. The visual and vestibular cues are time varying signals, whose reliabilities change as a function of time. They also can have different reliabilities depending on the context (as in A). Simply adding as in B is suboptimal. For instance, you would just be adding noise at the start when the visual signal is low. Xvis(t) = integrated evidence for the visual cue (optic flow), Xvest (t) is the integrated evidence for the vestibular cue. kvis is a constant that signifies the strength of the visual signal. kvestib is a constant that signifies the strength of the vestibular signal. The combined signal Xcomb (t)is the reliability-weighted sum of these two signals (weights are shown on top of the arrows). The dashed lines on the left-hand side of the figure denote the velocity and acceleration profiles of the signals. The velocity profile was Gaussian. Both visual and vestibular cues were presented congruently and were temporally synchronized. In this study, momentary evidence for vestibular input is assumed to result from acceleration (a(t)). The momentary evidence for visual input is thought to result from velocity cues (v(t)).

