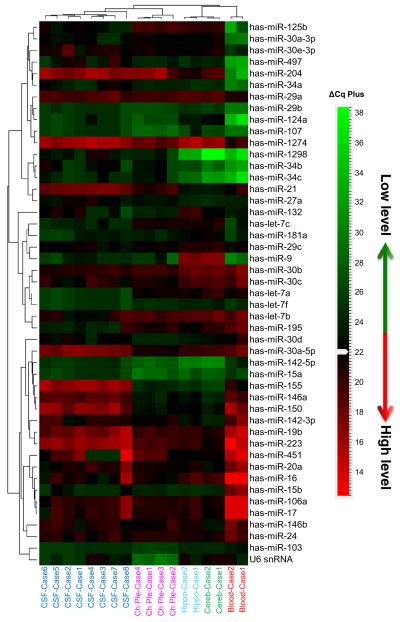
Fig. 6.
Hierarchical clustering of miRNA expression in CSF, blood, and tissue RNA was analyzed using CSF-miRNA TLDA. Cq values of each array were normalized by global mean method. Hierarchical clustering of expression patterns was determined by Pearson’s distance-average linkage. The heatmap indicated that miRNA patterns of CSF were relatively similar to that of the choroid plexus, the organ that generates CSF. CSF, blood, hippocampus, and cerebellum samples are marked in the same colors

