. 2017 Mar 28;6(1):A0055. doi: 10.5702/massspectrometry.A0055

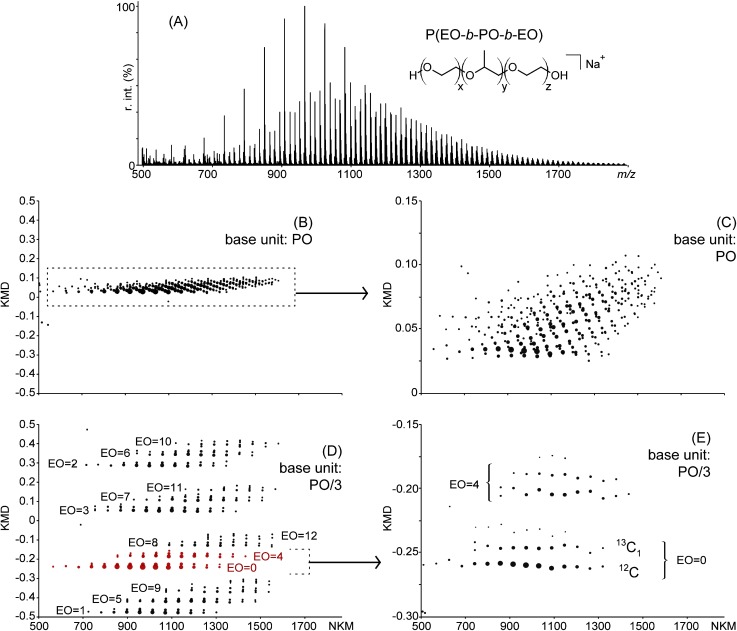
Fig. 4. A) MALDI mass spectrum of a P(EO-b-PO-b-EO) triblock copolymer 1100 g mol−1. B) Full scale KMD plot using PO as the base unit. C) Magnification of B) (KMD range: 0–+0.15). D) Full scale KMD plot using PO/3 as the base unit. The composition in EO is mentioned for each line. E) Magnification of D) (KMD range: −0.3–−0.15).

Fig. 4. A) MALDI mass spectrum of a P(EO-b-PO-b-EO) triblock copolymer 1100 g mol−1. B) Full scale KMD plot using PO as the base unit. C) Magnification of B) (KMD range: 0–+0.15). D) Full scale KMD plot using PO/3 as the base unit. The composition in EO is mentioned for each line. E) Magnification of D) (KMD range: −0.3–−0.15).