. 2017 Mar 28;6(1):A0055. doi: 10.5702/massspectrometry.A0055

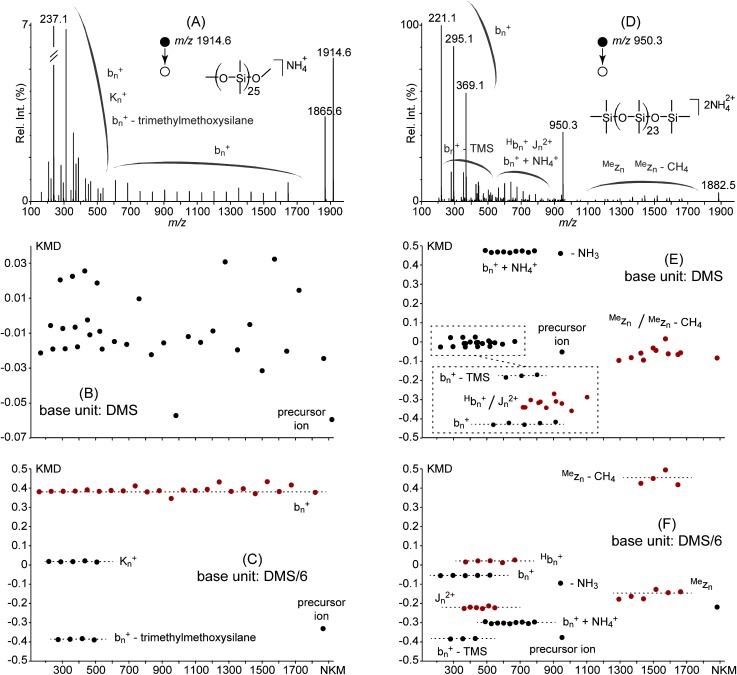
Fig. 5. (A) ESI-CAD mass spectrum of a (methyl, methoxy)-ended PDMS 25-mer adducted with ammonium ion. (B) KMD plot using DMS as the base unit. (C) Full scale KMD plot using DMS/6 as the base unit. (D)–(F) ESI-CAD mass spectrum of a doubly charged (trimethylsilyl, trimethylsiloxy)-PDMS 23-mer adducted with ammonium ion and its KMD plots using DMS and DMS/6 as the base units. Product ion notation is adapted from ref. 28.

Fig. 5. (A) ESI-CAD mass spectrum of a (methyl, methoxy)-ended PDMS 25-mer adducted with ammonium ion. (B) KMD plot using DMS as the base unit. (C) Full scale KMD plot using DMS/6 as the base unit. (D)–(F) ESI-CAD mass spectrum of a doubly charged (trimethylsilyl, trimethylsiloxy)-PDMS 23-mer adducted with ammonium ion and its KMD plots using DMS and DMS/6 as the base units. Product ion notation is adapted from ref. 28.