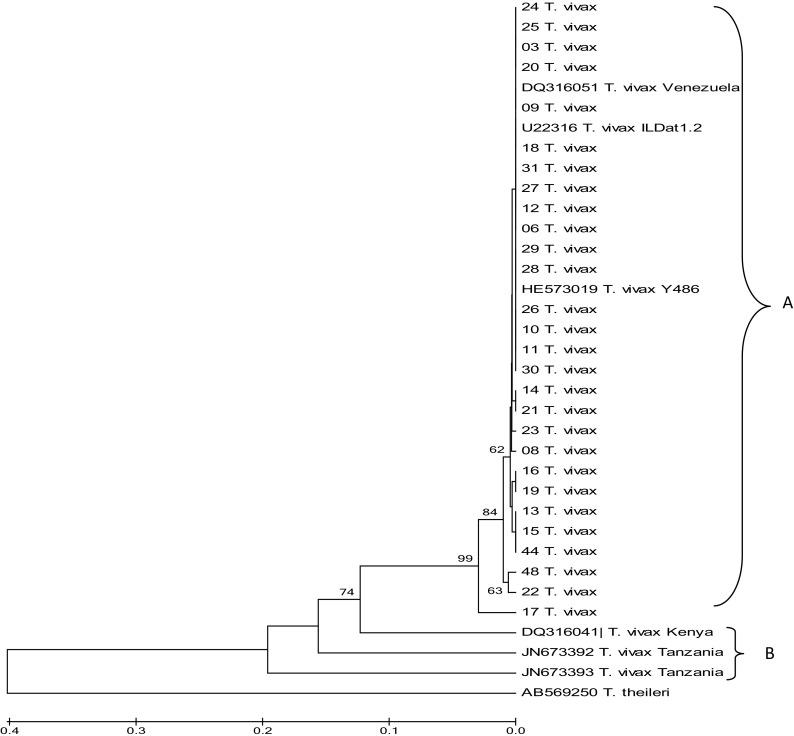
Fig. 4.

Evolutionary relationships of strains of T. vivax detected in Nigerian cattle and compared to other sequences from the GenBank, using ITS-1 rDNA sequences analyzed by the UPGMA method. The percentage of replicate trees above 50 % in which the associated taxa clustered together in the bootstrap test (1000 replicates) are shown next to the branches. The tree is drawn to scale, with branch lengths in the same units as those of the evolutionary distances used to infer the phylogenetic tree
