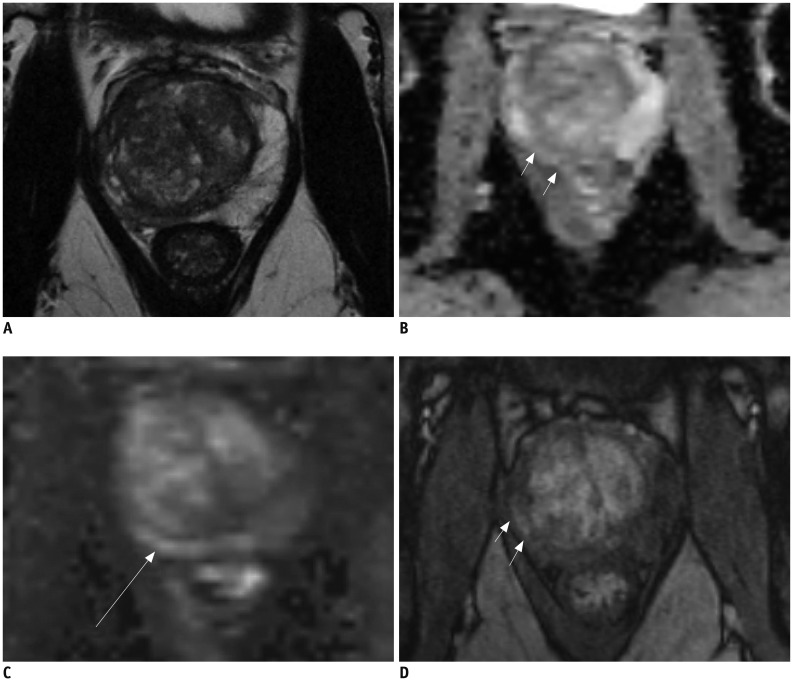
Fig. 1. 61-year-old male with fluctuating PSA and current PSA level of 7.5 ng/mL.
Prior biopsy session revealed no prostate cancer. A. T2-weighted MR imaging demonstrates asymmetric right peripheral zone with volume loss. Low signal intensity can be observed in right peripheral zone. B, C. ADC map (B) demonstrates intermediate signal intensity in right peripheral zone (arrows) and high b-value image (C) demonstrate intermediate to high signal intensity (arrow). D. T1-weighted post-contrast image demonstrates early uptake of contrast material in right peripheral zone (arrows). MR image guided biopsy revealed prostatitis and fibrosis. ADC = apparent diffusion coefficient, PSA = prostatespecific antigen

