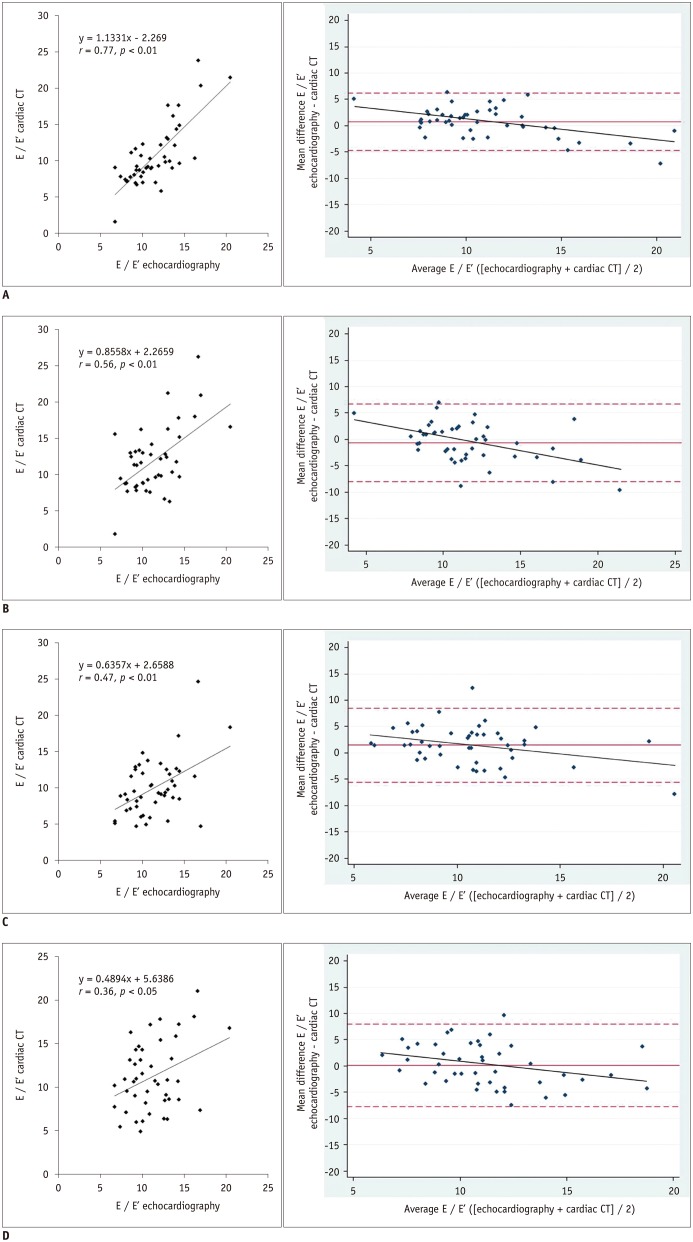
Fig. 3. Comparison between echocardiography and cardiac CT for assessment of left ventricular filling pressure (E / E′).
In Bland-Altman plots, solid lines represent mean differences, whereas dotted lines represent 95% limits of agreement. Note that differences are proportional to means (p < 0.05) in four absolute difference plots of two datasets. Bland-Altman plots show that cardiac CT has tendency to overestimate E / E′ as average measurements increase, and differences of E / E′ are proportional (p < 0.05) to mean in four absolute difference plots of echocardiography - CT datasets.
A. Scatter plot for dataset A with slice thickness of 0.9 mm at 5% increments (left). Bland-Altman plot with regression line (right) showing mean difference (95% limits of agreement) of 0.8 ± 2.8 cm/s (−4.7 to 6.2 cm/s) and r = 0.53 (y = −0.4329x + 5.5196, p < 0.05). B. Scatter plot for dataset B with slice thickness of 0.9 mm at 10% increments (left). Bland-Altman plot with regression line (right) showing mean difference of −0.6 ± 3.8 cm/s (−8.0 to 6.7 cm/s) and r = 0.47 (y = −0.5372x + 5.5945, p < 0.05).
C. Scatter plot for dataset C with slice thickness of 3 mm at 5% increments (left). Bland-Altman plot with regression line (right) showing mean difference of 1.5 ± 3.6 cm/s (−5.6 to 8.5 cm/s) and r = 0.32 (y = −0.3931x + 5.674, p < 0.05). D. Scatter plot for dataset D with slice thickness of 3 mm at 10% increments (left). Bland-Altman plot and regression line (right) showing mean difference of 0.1 ± 4.0 cm/s (−7.8 to 8.0 cm/s) and r = 0.32 (y = −0.4527x + 5.2039, p < 0.05).

