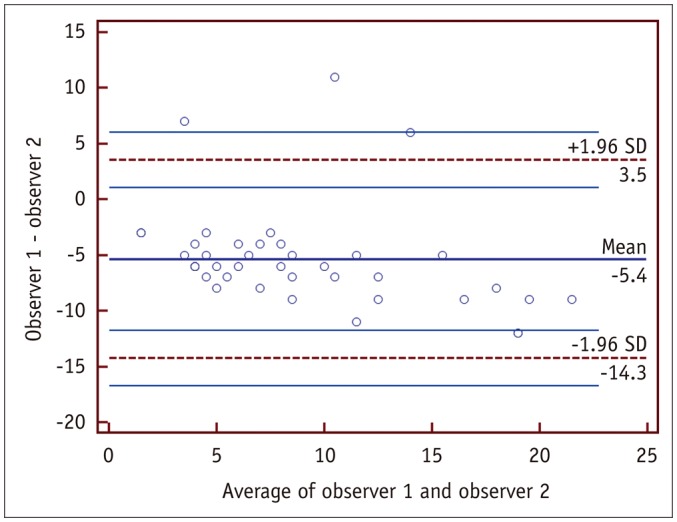
Fig. 1. Bland-Altman analysis plot comparing observer 1 and observer 2 for measurement of TAG in 40 randomly selected cases.

Mean difference of TAG measured by two raters was -5.4 HU/10 mm. HU = Hounsfield units, SD = standard deviation, TAG = transluminal attenuation gradient
