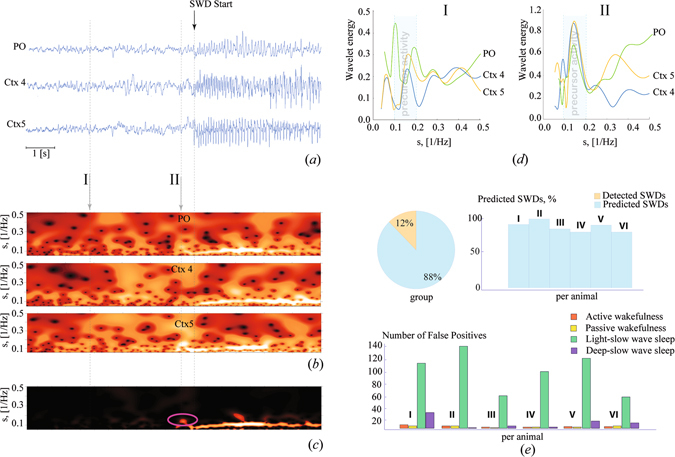
Figure 1.

(a) A set of EEG recordings taken from subgranular layers 4 (Ctx4) and 5 (Ctx5) of the somatosensory cortex and postero/lateral nucleus of the thalamus (PO). (b) Energy of wavelet transformation, corresponding to the EEG signals shown above and distributed over the range of timescales s = 1/f, where f is the linear frequency. (c) The resulting surface . The oscillatory pattern occurring prior to SWD onset, which is considered as a precursor of SWD, is encircled. (d) The momentary distributions of the wavelet energy in the 5–10 Hz band, taken for 4 seconds (I) and ~0.5 second (II) before SWD onset. The left figure shows that at 4 seconds before SWD onset only cortical EEGs exhibit a local synchronization in the precursor band (i.e. the local increase of energy appears in the frequency ~7 Hz). The wavelet energies of the cortical EEGs exhibit a synchronized increase (i.e. the lines are aligned to each other), while the wavelet energy of the thalamic EEG does not (i.e. the thalamic line is shifted relative to the others). The right figure shows that at ~0.5 second before SWD onset the wavelet energy is increased for all three channels. (e) Percentage of predicted and detected SWDs within the 4 hours recording of the first group of six WAG/Rij rats. Remember that no SWDs remained undetected by this (first) algorithm, the SWDs that were not predicted were quickly detected; Number of false positives across different states of alertness. For each rat and each state of alertness, 5 segments of 50 seconds duration were randomly selected in each recording for quantification of the number of false alarms.
