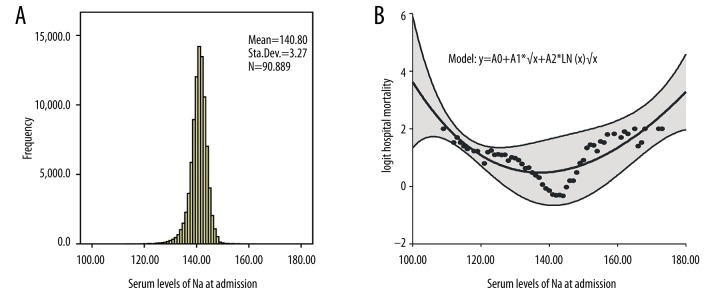
Figure 3.
The histogram of the serum sodium levels at admission and its relation to hospital mortality. (A) The histogram of serum sodium levels at admission; (B) Non-linear relationship between baseline serum sodium levels and the predicted probability of hospital mortality. The range area indicates 95% confidence intervals.

