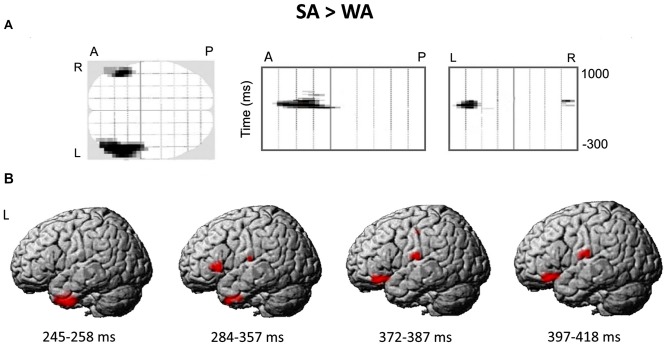
Figure 4.
The differential brain response to the nouns from Strong Association (SA) and Weak Association (WA) categories: statistical parametric mapping analysis in sensor and source space. (A) The three projections (SPM glass image) show the sensor array from above (transverse), the right (sagittal) and the back (coronal). A-anterior, P-posterior, L-left and R-right parts of the array. Areas in black correspond to spatial clusters with significant sensor-level differences in ERF between the SA and WA nouns (t-test, p < 0.05, family-wise error rate (FWE)-corrected). All the clusters reflect greater response to the SA vs. WA nouns within four time windows of 245–258 ms, 284–357 ms, 372–384 ms and 397–418 ms after the cue onset, and are spatially confined to the left anterior quadrant of the sensor map. No clusters with opposite direction of the effect were found. (B) The reconstruction of cortical sources underlying greater ERF to the SA vs. WA nouns. Cortical sources were modeled within the time windows defined by the significant results of the sensor-level analysis. The statistical maps were threshold using a voxel-wise statistical threshold of p < 0.05.

