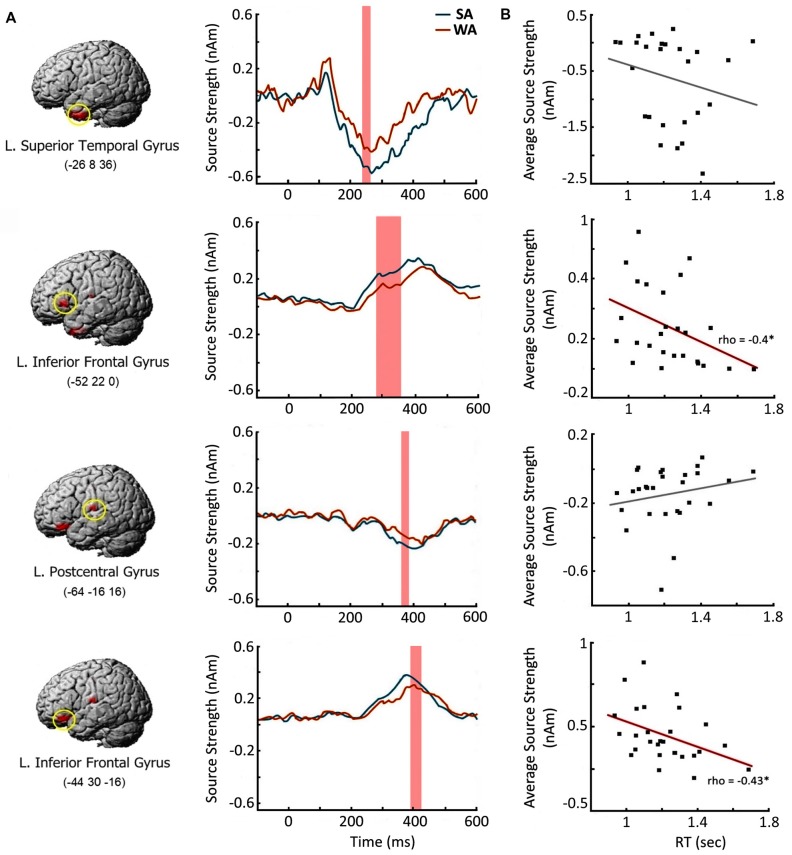
Figure 5.
Brain response elicited by the Strong Association nouns: time course and relation to the speed of verb generation. (A) Cortical regions with greater response to Strong Association (SA) vs. Weak Association (WA) nouns and their time courses. Left column contains the brain images and their MNI coordinates. Middle column depicts the time courses in the peak vertex of the respective cortical region. Shaded bars denote the time windows with significant SA-WA differences. (B) Correlations between the activation strength in response to the noun cue and the speed of verb generation in SA condition. X axis denotes the reaction times in verb generation task in seconds (sec). Y axis represents the average source strength in nanoamperes (nAm) within the time windows of significant SA-WA differences. The significant Spearman correlations are marked by asterisks. Note, that greater cortical response to the noun cue in the left ventrolateral prefrontal cortex (VLPFC) is associated with the faster verb production.

