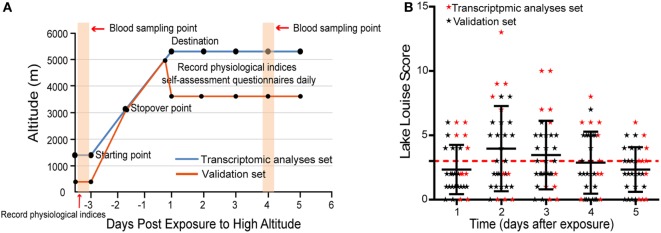
Figure 1.
The distribution of Lake Louise Scores and symptoms during the investigation period. (A) Schematic of study procedure. (B) Scatter plot for the LLS of all individuals. The numbers correspond to the days when acute mountain sickness (AMS) was assessed. The red dashed line denotes the threshold of diagnosis for AMS.

