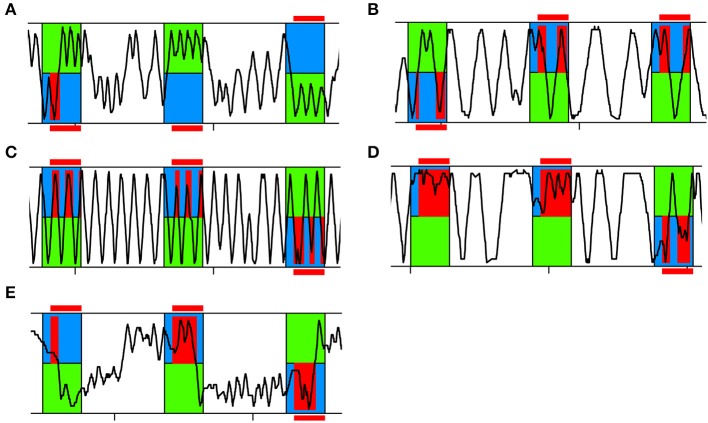
Figure 3.
Representative running traces of individual bees in APIS. Three training trials are shown. The bee was exposed to 14 s of blue and green light fields. After a 3 s delay the bee experienced shock when located on the blue side (red). (A) Typical running trace of a bee spending more time on the green side than on the blue side, thus achieving high Performance Indices (PIs). (B) Typical running trace of a bee spending more time on the blue side than on the green side, thus achieving low PIs. (C) Typical running trace of a bee with an equal number of reversals on the green and blue side, thus achieving a Reversing Difference close to zero. (D) Representative running trace of a bee reversing more often on the blue side than on the green side, thus achieving a negative Reversing Difference. (E) Typical running trace of a slowly responding bee taking a long time to cross over to the green side at the beginning of each trial and after light-onset, thus achieving a high Crossing Latency.

