Figure 5.
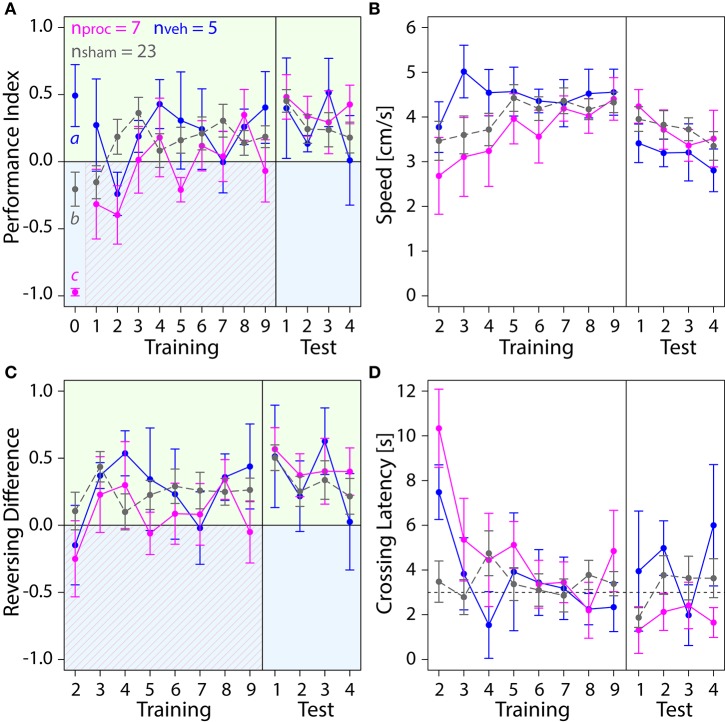
Comparison of behavior in the APIS assay for bees injected with the vehicle (blue) or procaine solution (magenta) into the MBC, or sham-treated bees (gray). All groups learned to spend more time on the green side. Means ± SEM are plotted for all variables. Significant treatment effects determined with an LMM (p < 0.05, Table S1) are indicated with letters a, b, and c. Bees were subjected to one preference test (0) nine training trials and four test trials. (A) An LMM indicated an effect of treatment on Performance Index (PI) in the preference test (Table S1). Treatment comparison with a Tukey HSD post-hoc test revealed differences in PIs of vehicle and sham groups (z = 2.631, p = 0.02), PIs of procaine and sham groups (z = −3.310, p = 0.003) and PIs of procaine and vehicle groups (z = −4.657, p < 0.001). An LMM indicated a significant difference between PIs of procaine and sham groups in training (Table S1), but a Tukey post-hoc test, which corrects for multiple testing indicated no difference between PIs of these groups (z = 2.080, p = 0.09). No effect of treatment on PIs was found for the test phase (LMM, Table S1). All bees spent more time on the green side and avoided the shock-paired blue side (shocks indicated by diagonal lines) after a few trials. (B) Speed did not differ between experimental groups (LMM, Table S1). (C) Number of reversals on the green side was higher after one conditioning trial. No effect of treatment on Reversing Differences was found in training or in the test phase (Table S1). (D) Crossing Latency approached the 3-s threshold (horizontal dashed line) over the course of training, which corresponds to the delay between light-onset and shock-onset. No significant effect of treatment on Crossing Latency was found for training or in the test phase (Table S1).

