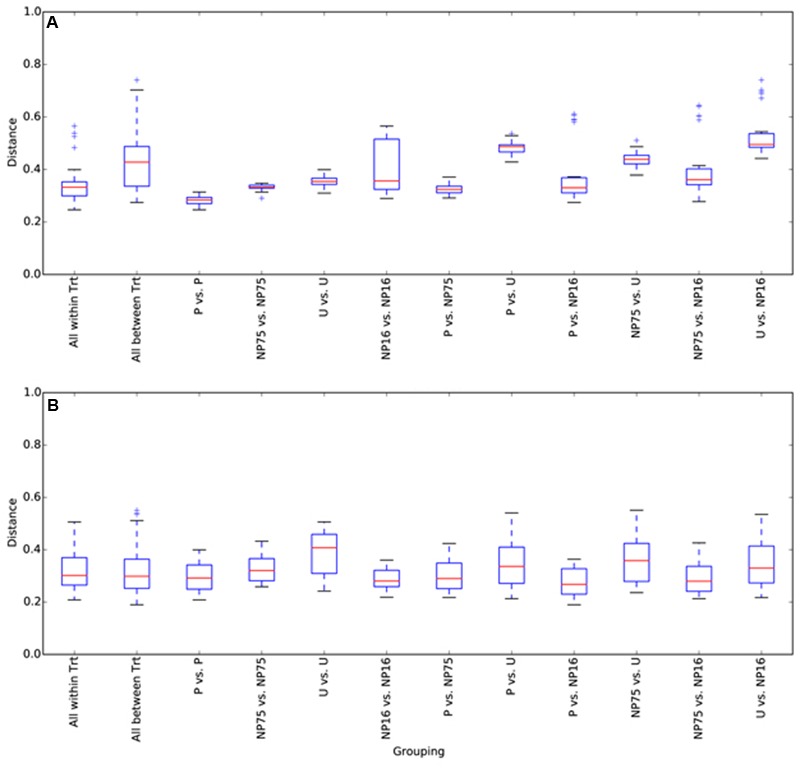
FIGURE 2.

Box and whisker plots for beta diversity distances of 16S rRNA gene libraries within and between treatments for (A) water and (B) sediment samples. The plot was constructed using the lower and upper quartile of the data (“whiskers” extending from either end of the box; one going from the first quartile to the smallest non-outlier and the other going from third quartile to the largest non-outlier), the inter-quartile range (width of the “box”; the bottom and the top being the lower and upper quartile, respectively), median (red line) and outliers (+ sign). Trt, treatment.
