FIGURE 6.

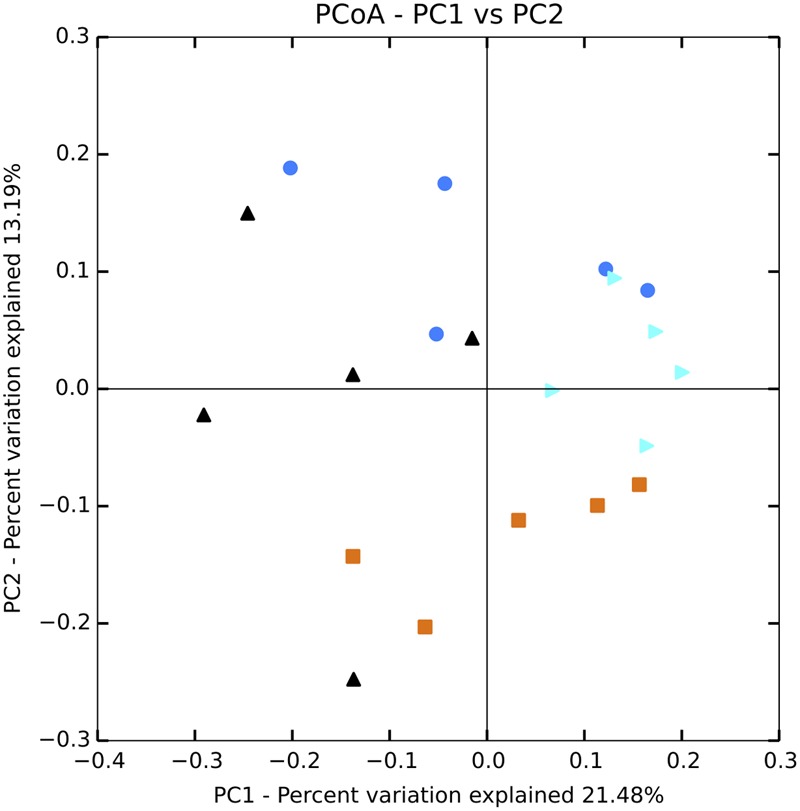
Principal coordinates analysis plot of Bray–Curtis distances for eukaryote communities in the water column. Black = unenriched, orange = P-only, light blue = NP16, dark blue = NP75.

Principal coordinates analysis plot of Bray–Curtis distances for eukaryote communities in the water column. Black = unenriched, orange = P-only, light blue = NP16, dark blue = NP75.