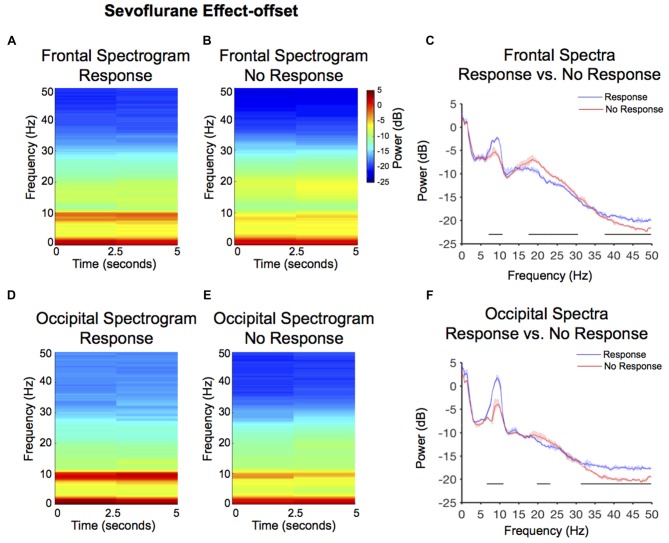
Figure 4.
Spectral comparison of response vs. no-response curves during anesthesia effect-offset. (A,B) Median frontal spectrograms of response and no-response (n = 8). (C) Overlay of median response frontal spectrum (blue), and median no-response frontal spectrum (red). Bootstrapped median spectra are presented, and the shaded regions represent the 99% confidence interval for the uncertainty around each median spectrum. We observed differences in power among frequency bands within response and no-response spectra (Table 1). Black lines represent statistically significant frequencies. (D,E) Median occipital spectrograms of response and no-response (n = 8). (F)Overlay of median response occipital spectrum (blue), and median no-response occipital spectrum (red), with shaded regions showing the 99% confidence interval for uncertainty around each bootstrapped median spectrum. We observed differences in power among frequency bands within response and no-response spectra (Table 1). Black lines represent statistically significant frequencies.

