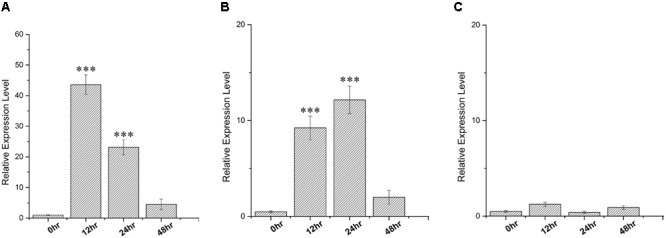
FIGURE 2.

qRT PCR analysis carried out in Sorghum bicolor for relative expression of SbDhn1 under different stress conditions at different time points (0, 12, 24, and 48 h) where the EIF1 gene was used as an internal control to normalize the expression level. (A) High temperature (48°C), (B) osmotic stress generated by supplementing 200 mM sorbitol in MS medium, and (C) low temperature (4°C). Expression levels were statistically analyzed against unstressed plants using student’s t-test (∗∗∗ P < 0.0001). Data shown are illustrative of at least three independent experiments.
