Figure 1.

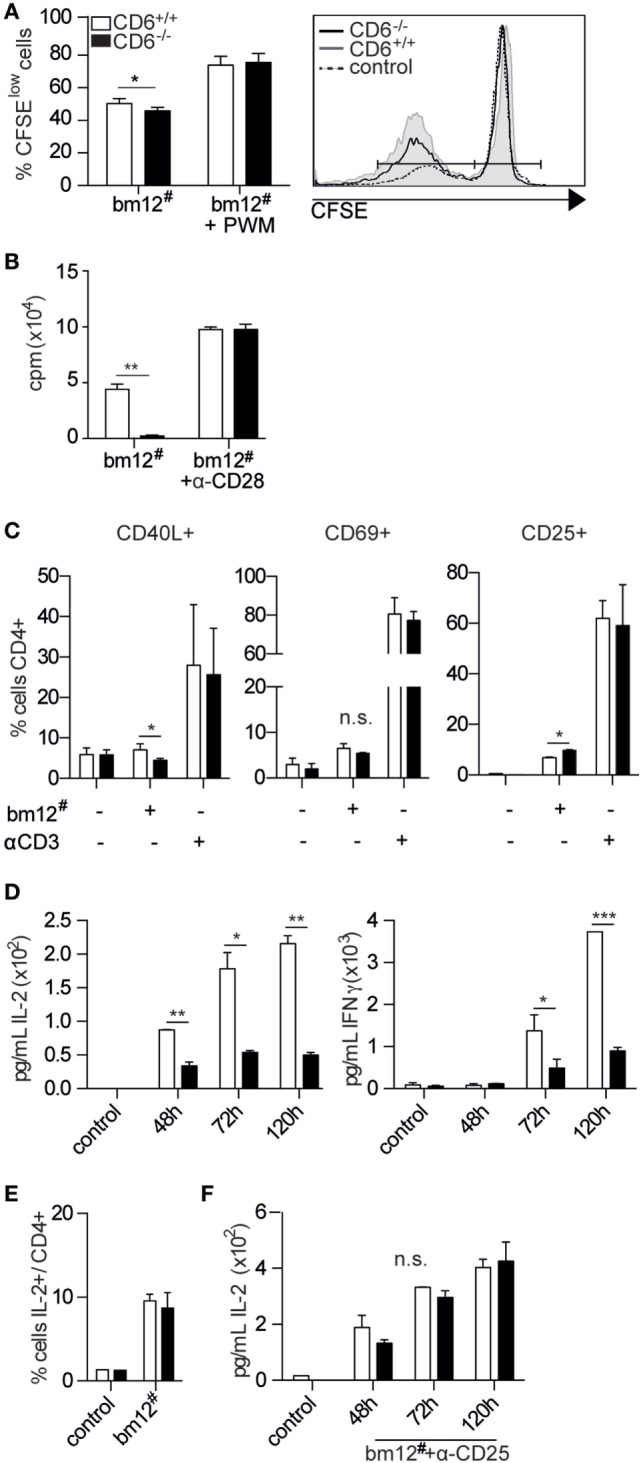
In vitro activation and proliferative responses of spleen CD6−/− cells to allogeneic mixed lymphocyte reaction (MLR) stimulation. (A) Responder CFSE-stained total splenocytes from CD6−/− (solid bars) or CD6+/+ (empty bars) mice were cocultured for 5 days at a 2:1 ratio with irradiated total bm12 splenocytes (bm12#) as stimulators. Percentage (mean ± SD) of proliferating B cells (CFSElow) following MLR-induction alone or in the presence of Pokeweed mitogen (PWM) is shown. Data shown are triplicate samples from one representative experiment of three performed. (B) Spleen CD4+ T cells isolated by negative selection from CD6−/− (solid bars) or CD6+/+ (empty bars) mice were cocultured for 5 days with irradiated bm12 splenocytes (bm12#) in the presence or absence of anti-CD28 monoclonal antibody (mAb) (α-CD28, 1 µg/mL). The bar chart shows the [3H]-thymidine incorporation (in cpm) of triplicate samples from one representative experiment of four performed. (C) Same sorted CD4+ T cells from (B) were stimulated for 24 h and analyzed for CD40L, CD69, and CD25 surface expression in CD4+ gated T cells by flow cytometry. A representative experiment of three performed is shown. (D) Bart charts representing the IL-2 (left-hand side) and IFN-γ (right-hand side) levels (pg/mL) over time from supernatants of same cocultures as in (B). (E) Percentage (mean ± SD) of intracellular IL-2-positive cells among CD4+ spleen T cells from day 5 of same cocultures as in (B). (F) IL-2 levels (pg/mL) over time from supernatants of same cocultures as in (B) in the presence of exogenously added blocking anti-CD25 mAb (30 µg/mL). n.s., not significant; *p < 0.05; **p < 0.01; ***p < 0.001 (Student’s t-test).
