
Figure 2.
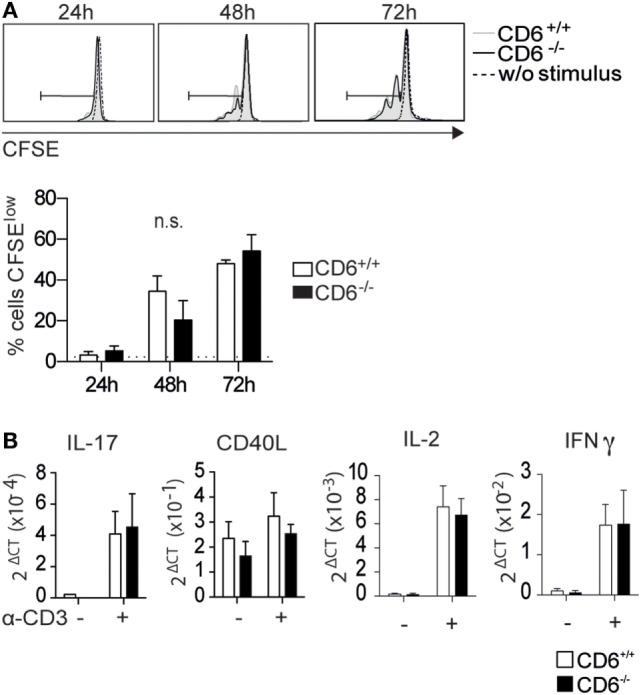
In vitro activation and proliferative responses of spleen CD4+ T cells from CD6−/− and CD6+/+ mice to CD3 cross-linking. (A) Sorted spleen CD4+ T cells from untreated CD6−/− and CD6+/+ mice were CFSE-labeled and cultured for 3 days either alone or plastic-bound anti-CD3 monoclonal antibody (1 µg/mL) for further flow cytometry analysis. The histogram shows the CFSE fluorescence intensity from a representative experiment of four performed, at different time points. (B) CD4+ T cells stimulated as in (A) for 7 h were analyzed for mRNA expression levels of the indicated genes by real-time PCR. The bar charts represent quintuplicate mRNA values from six pooled mice, where ΔCt indicates the difference in the threshold cycle between GADPH and target genes. n.s., not significant (Student’s t-test).