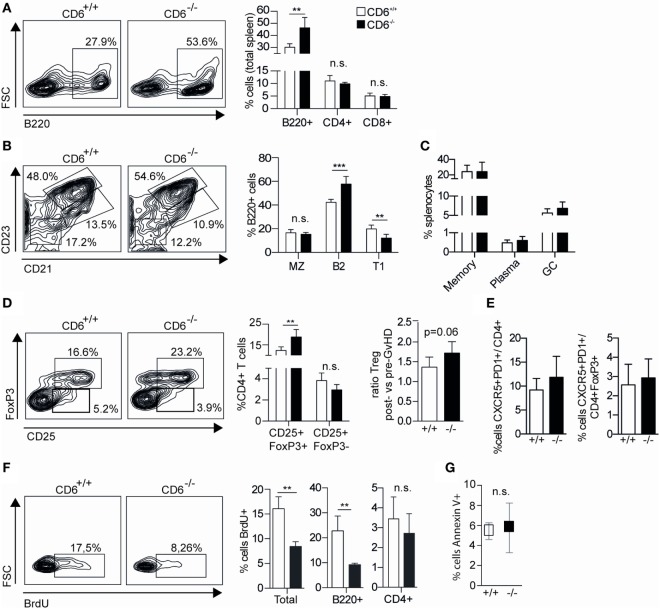
Figure 7.
Lymphocyte subset analysis of spleens from CD6−/− and CD6+/+ mice undergoing chronic graft-versus-host disease (cGvHD)-induced lupus-like disease. (A) Flow cytometry contour plots of B220+ cells and percentage (mean ± SD) of B220+, CD4+, and CD8+ cells from total spleens harvested at week 5 post cGvHD induction in CD6−/− (n = 6; solid bars) and CD6+/+ (n = 6; empty bars) mice. (B) Flow cytometry contour plots and percentages (mean ± SD) of spleen B220+ cells with marginal zone B cells (MZ, CD21+CD23low), follicular (B2, CD21+CD23+), and transitional type 1 (T1, CD21−CD23−) phenotypes from the same groups of mice as in (A). (C) Percentages (mean ± SD) of memory (CD19+CD138−IgD−IgM−), plasma (CD19− CD138+), and germinal zone B-cells (CD19+GL-7+) from the same groups of mice as in (A). (D) Percentages (mean ± SD) of follicular helper (TFH; CD4−CXCR5+PD1+) and follicular regulatory T cells (Treg) (TFR; CD4−CXCR5+PD1+ FoxP3+) from the same groups of mice as in (A). (E) Left, Percentage (mean ± SD) of CD4+ spleen T cells with regulatory (CD25+FoxP3+) and activated (CD25+FoxP3−) phenotypes from the same groups of mice as in (A). (E) Right, Increment in the percentage of spleen Treg (CD4+CD25+FoxP3+) cells at week 5 postinduction of cGvHD in the same groups of mice as in (A). Results are expressed as the ratio (mean ± SD) resulting from dividing the percentage of Treg at week 5 by that at week 0. (F) Flow cytometry contour plots and percentage (mean ± SD) of BrdU+ cells from total, B220+ and CD4+ splenocytes at week 5 from the same groups of mice as in (A). (G) Percentage (mean ± SD) of total spleen cells with late-stage apoptotic phenotype (Annexin V+ 7-AAD+) from the same groups of mice as in (A). In all cases, data shown are from one representative experiment of three performed. n.s., not significant; BrdU, bromodesoxyuridine; **p < 0.01; ***p < 0.001 (Student’s t-test).

