
Figure 4.
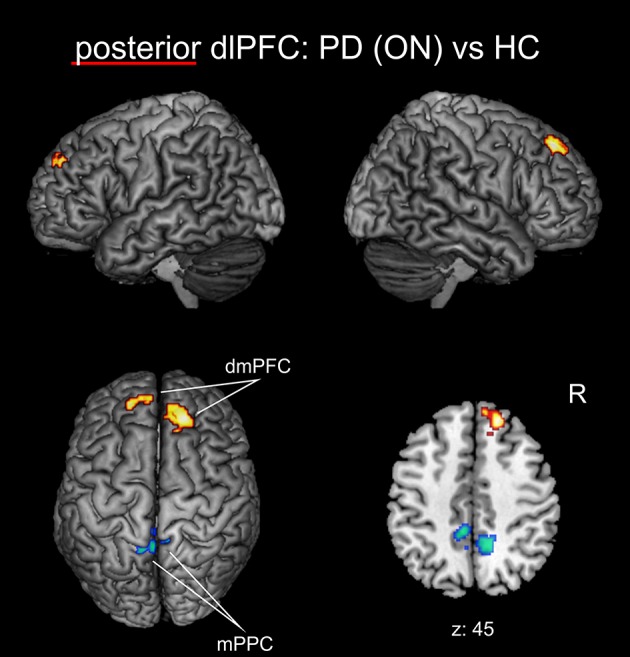
Functional connectivity changes between PD patients in the medical ON state and healthy controls with the posterior right dlPFC seed projected onto the MNI single subject brain. Hot colors indicate regions with significantly increased, cold colors regions with significantly decreased functional connectivity. Left lateral, right lateral, and top views as well as a representative axial section are shown. Label under the axial section represents z-coordinate in MNI space. R: right side.