Figure 3.
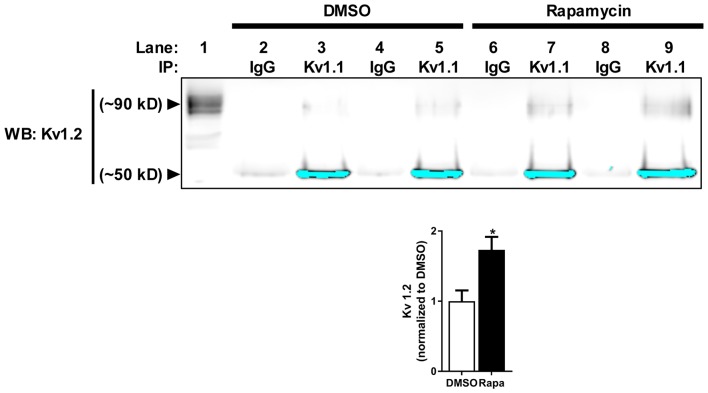
Reduction of mTOR activity increases Kv1.1–1.2 association in vivo. Kv1.2 subunit co-immunoprecipitates with Kv1.1. The high molecular weight (~90 kD) Kv1.2 subunit assembles more with Kv1.1 in mice treated with rapamycin (1.73 ± 0.19) compared to DMSO (1.00 ± 0.15) as measured by densitomery analysis. IP denotes the antibody used to immunoprecipitate Kv1.1 from samples (1 mg/mL) in lanes 2–9. IgG serves as antibody control for immunoprecipiration (lanes 2, 4, 6 and 8). Kv1.2 is enriched in samples that contain Kv1.1 antibody-conjugated beads (lanes 3, 5, 7 and 9) compared to IgG-conjugated beads. The signals at ~50 kD are the low molecular Kv1.2 species and have been saturated to visualize Kv1.2 at ~90 kD. The high molecular weight is the extracellular fraction, and the low molecular is the intracellular fraction of Kv1.2 (Zhu et al., 2003). Lane 1 is the input lane, which is 1% (10 μL) of the total volume that was used to immunoprecipitate Kv1.1. Representative images and quantification (average ± SEM) are shown. N = 4 animals per condition. Statistics: Student’s t-test; *p < 0.05.

