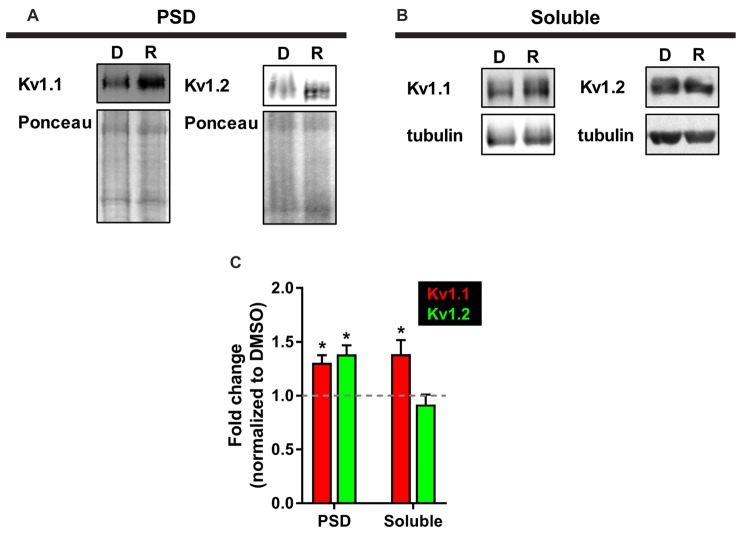
Figure 5.
More Kv1.1 and Kv1.2 cofractionate in the PSD with mTORC1 inhibition in vivo. (A) Representative Western blots depicting increased levels of Kv1.1 and Kv1.2 in the PSD fraction (Triton X-100 insoluble) of synaptoneurosomes with mTORC1 inhibition by rapamycin (R). DMSO (D) served as control. Total protein as measured by densitometry of Ponceau-S staining was used to normalize Kv1.1 and Kv1.2 protein expression. (B) In the soluble fraction (Triton X-100 soluble) of synaptoneurosomes, only Kv1.1 protein was increased with rapamycin. Tubulin was used to normalize Kv1.1 and Kv1.2 protein levels. (C) Quantification (average ± SEM) is expressed as densitometric ratio between protein values in rapamycin-treated and DMSO-treated rats. Kv1.1 (PSD = 1.31 ± 0.07; Soluble = 1.39 ± 0.13). Kv1.2 (PSD = 1.39 ± 0.08; Soluble = 0.92 ± 0.09). N = 3 animals per condition. Statistics: Student’s t-test; *p < 0.05.

