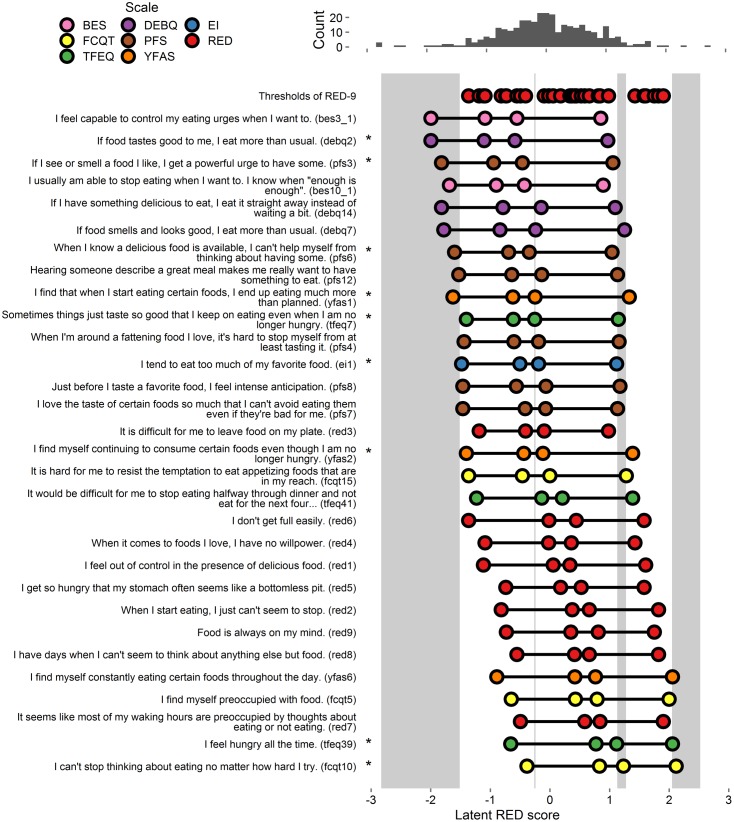
FIGURE 3.
Person-item map and histogram depicting thresholds on the spectrum of RRE for Study 3. See Figure 1 note. This figure includes the RED-9 items the 21 items that account for variance in the gap areas. For a graph on all items tested, see Supplementary Figure S3. Stars indicate items selected by authors for inclusion in Study 4.

