Figure 1.

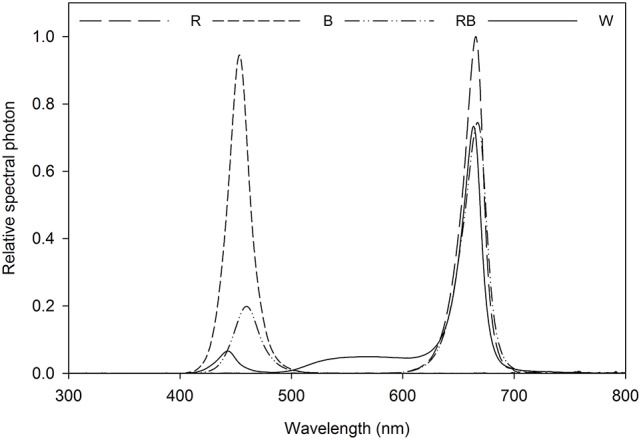
Relative spectral distribution of the light treatments: Red (R), Blue (B), Red/Blue (3:1) (RB) and white (W). Spectrum was measured at the plant canopy level with a JAZ spectrometer (Ocean Optics, FL, US).

Relative spectral distribution of the light treatments: Red (R), Blue (B), Red/Blue (3:1) (RB) and white (W). Spectrum was measured at the plant canopy level with a JAZ spectrometer (Ocean Optics, FL, US).