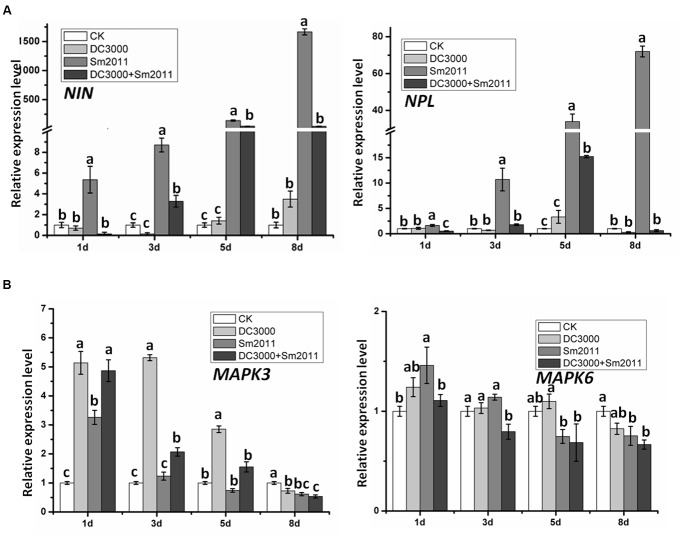
FIGURE 4.
Quantitative RT-PCR analysis of symbiosis genes and MAPK gene expression patterns during early stages of nodule formation and Pst DC3000-induced disease. (A) Expression of NIN and NPL mRNA in total plants of M. truncatula. (B) Expression of MAPK3 and MAPK6 mRNA in M. truncatula. Total plants were harvested 1, 3, 5, and 8 dpi with S. meliloti Sm2011, Pst DC3000 or co-inoculation. Plants mock treated with water (uninoculated plants, CK) were also harvested at the same time intervals and served as a mock control. The RNA-binding protein (RBP1, GenBank: AJ508392.1) gene was used as an internal control (Bourcy et al., 2013). In all experiments, three independent replications were performed. The values are presented as the means ± SD. Different letters indicate significant differences as determined by a t-tests (p ≤ 0.05).

