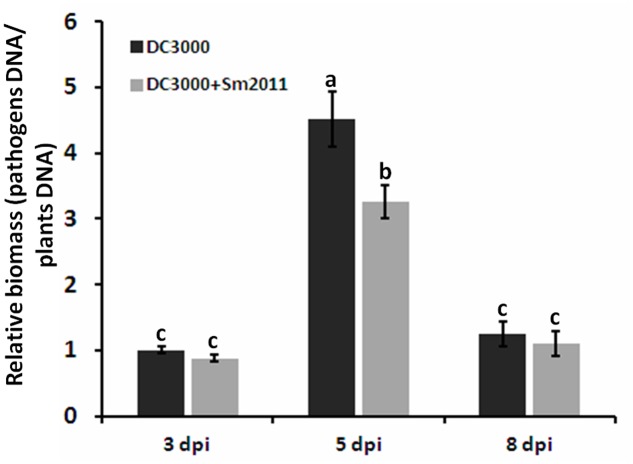
FIGURE 8.
The growth of Pst DC3000 was determined by qPCR-based biomass. Disease progression of on M. truncatula plants inoculated with Pst DC3000 and/or S. meliloti Sm2011 at 3, 5, and 8 dpi. For qPCR analysis about 30 ng of DNA were mixed with 0.4 mM gene specific primers [bacterial biomass: oprf gene (Ross and Somssich, 2016), plant biomass: actin]. Normalized plant DNA of actin and normalized pathogen DNA of oprf, pathogen or plant DNA is related to plant biomass. The error bars indicate standard deviations of three independent biological replicates. Different letters indicate significant differences as determined by a t-tests (p ≤ 0.05).

